
Mapping the Big Picture: Complete Chapter-by-Chapter Summary
Welcome to our deep dive into transforming education through data. Today, we're exploring the book *Using Curriculum Mapping and Assessment Data to Improve Learning* by Bena Kallick and Jeff Colosimo.
This presentation serves as a navigational blueprint for transforming educational cultures. We focus on the mechanical integration of curriculum mapping and targeted assessment data to drive real student growth.
The core idea is simple yet powerful: move away from teaching based on tradition or guesswork, and instead anchor every decision in data. When schools build a data-driven culture, teachers gain a clear view of student progress and gaps, allowing them to adjust instruction in real time. Administrators can identify systemic issues across grades and subjects, ensuring resources are used where they matter most.
This isn't just about collecting numbers; it's about creating a shared vision where data becomes the engine of learning, not just a report card at the end of the year. By aligning our curriculum, our assessments, and our instructional strategies, we can close achievement gaps and ensure every student reaches their full potential. Let's begin by understanding how to build this culture from the ground up.
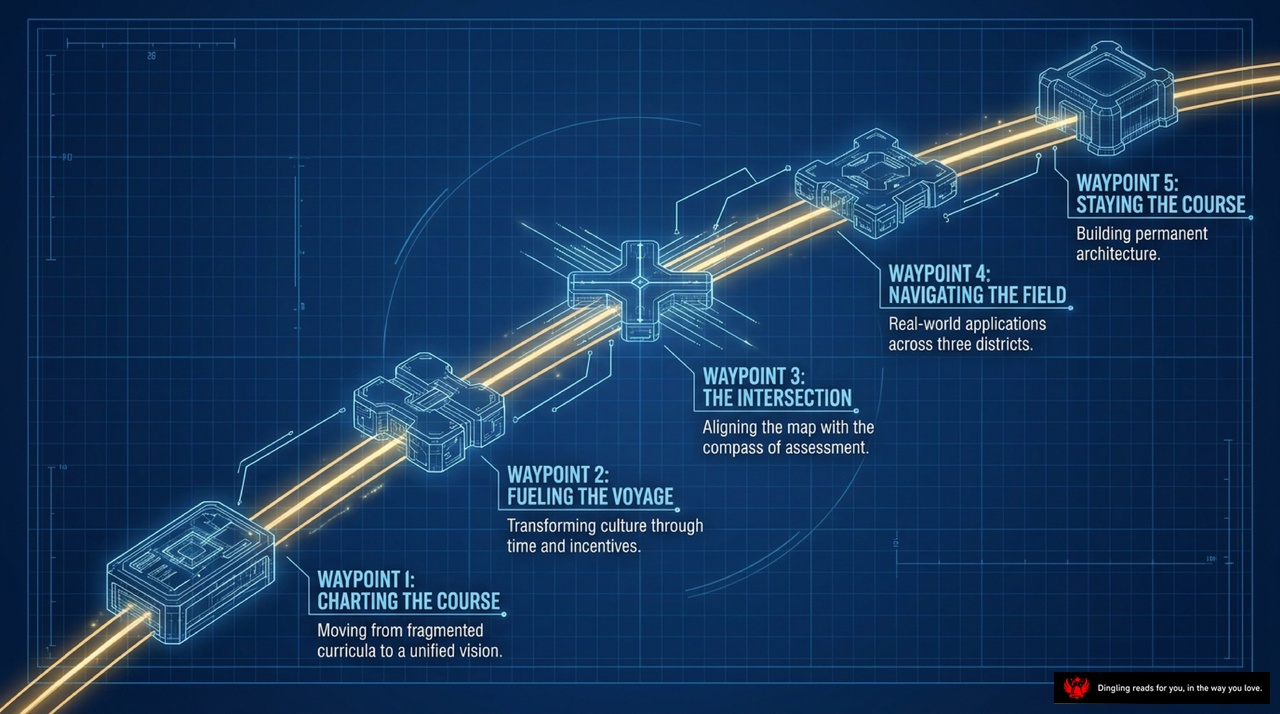
Imagine your school's curriculum not as a static document, but as a living journey with five critical milestones. This slide maps out exactly how we transform a fragmented system into a unified, data-driven vision.
It starts at Waypoint 1: Charting the Course. This is where we move away from disjointed lesson plans and establish a single, clear vision for every student. We align our teaching directly to academic standards, ensuring that what we teach matches what students are expected to know.
Next, we fuel that voyage at Waypoint 2. Here, we transform our school culture by using time and incentives effectively. We stop working in silos and start collaborating, using data to make real-time decisions that improve instruction for every child.
Then, we reach Waypoint 3: The Intersection. This is the crucial moment where we align our map with our compass of assessment. By integrating classroom checks, benchmark tests, and state results, we ensure that our evaluation actually drives our teaching, rather than just judging it at the end.
Moving forward to Waypoint 4, we navigate the field by applying these insights across three key districts or grade levels. We look for gaps and redundancies, making sure our curriculum is coherent and that students aren't learning the same thing twice or missing critical skills.
Finally, at Waypoint 5, we stay the course by building permanent architecture. This means embedding these practices into our school's DNA so that data-driven decision-making becomes the natural way we operate, ensuring lasting improvement for all our students.

Today's slide breaks down the journey from a static textbook to a living, breathing curriculum. We're moving through three distinct phases.
First, we have the Written Curriculum. Imagine this as the "Curriculum Guide" sitting on the desk—a text-heavy binder that often gets ignored. It creates a fragmented experience because it rarely reflects what actually happens in the classroom.
Next, we move to the Taught Curriculum. Think of this as a dynamic map with a compass and an arrow, reflecting the operational realities of your classroom. It accounts for pacing and the actual flow of learning, rather than just a static list of topics.
Finally, we arrive at the Core Consensus Curriculum. Visualized here as interlocking gears, this phase represents agreed-upon essentials that guarantee continuity across your school. Crucially, these gears are designed with built-in flexibility, allowing for differentiated instruction so every student can succeed.
The goal is to shift from a rigid, text-heavy guide to a flexible, consensus-driven system where the curriculum truly adapts to the students in front of you.
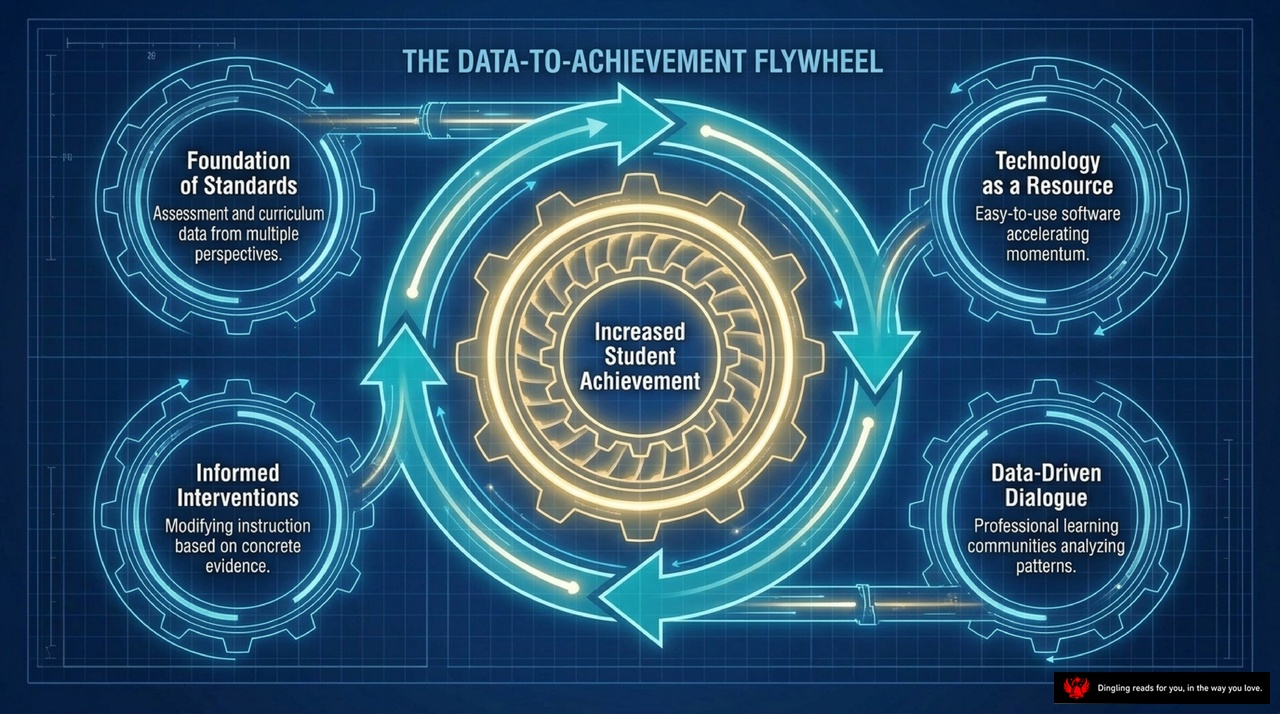
Look at this "Data-to-Achievement Flywheel." It's not just a diagram; it's the heartbeat of a school that actually moves the needle on student success. At the very center, we have "Increased Student Achievement," but that doesn't happen by accident. It's the result of four gears working in perfect sync.
First, we start with the **Foundation of Standards**. This is about taking assessment and curriculum data from multiple perspectives to build a solid base. You can't drive if you don't know where you're going, and you can't improve what you don't measure.
Next, that data fuels **Informed Interventions**. Instead of guessing what a student needs, we modify instruction based on concrete evidence. If the data shows a gap in a specific skill, we adjust the teaching right then, rather than waiting for the end of the year.
Then, we bring in **Technology as a Resource**. This isn't just about having computers; it's about using easy-to-use software to accelerate momentum. Good tools turn messy spreadsheets into clear insights, helping teachers spot patterns instantly.
Finally, we create a **Data-Driven Dialogue**. This is where professional learning communities come in. Teachers stop working in silos and start analyzing patterns together. When educators talk about the data, they share strategies, solve problems collaboratively, and lift each other up.
When these four elements spin together, they create a flywheel effect. The data informs the teaching, the teaching improves the results, and those results feed back into the data, creating a continuous cycle of growth. It's a powerful system that turns raw information into real student achievement.
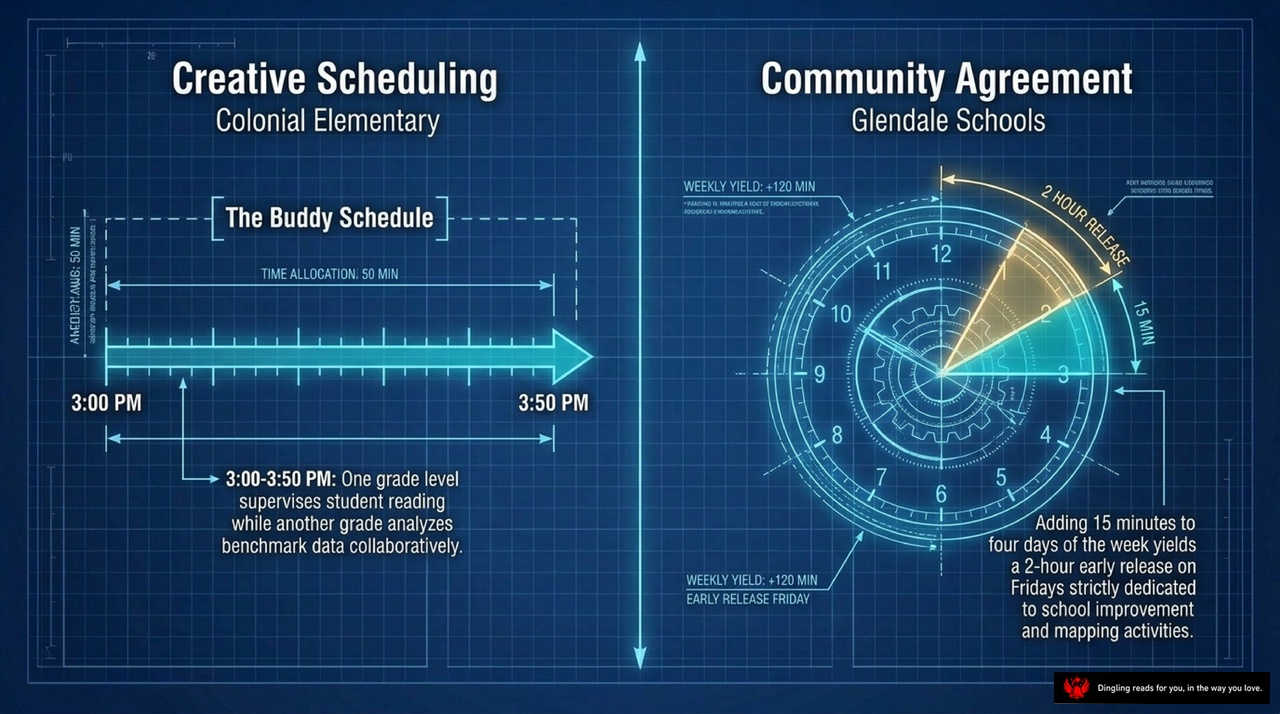
Look at this blueprint for a data-driven school. On the left, we see Colonial Elementary's "Buddy Schedule." It's a clever time-allocation hack: from 3:00 to 3:50 PM, one grade level supervises student reading while another analyzes benchmark data. This simple swap creates a 50-minute window for deep collaboration without extending the school day.
On the right, Glendale Schools takes it a step further with their "Community Agreement." By adding just 15 minutes to four days of the week, they unlock a full two-hour early release on Fridays. This block isn't just for leaving early; it's strictly dedicated to school improvement and mapping activities.
These examples prove that time is the ultimate currency in a data-driven culture. As the text emphasizes, effective time organization requires building layers of support: short, frequent grade-level meetings for immediate decisions, longer cross-grade sessions for curriculum continuity, and even district-wide professional development days. When leaders like the former assistant superintendent at Glendale secure these protected times, teachers move from being isolated individuals to a collaborative team. They stop asking, "How do I fix my lesson?" and start asking, "What does the data tell us about our students?" This shift from isolation to shared leadership is exactly what transforms a school from a collection of classrooms into a true learning organization.

Imagine a school where leadership isn't a title held by the principal alone, but a dynamic engine distributed across every teacher's desk. This is the power of **Distributed Leadership**, and today we're looking at exactly how it works in practice.
As you can see on this slide, this engine drives three critical roles that transform data from a passive record into an active tool for growth. First, we have the **Data Miners**. These are the teachers who excel at finding root causes within software reports. They don't just look at single figures; they separate those numbers from systemic patterns to uncover the real story behind the scores.
Next, we have **Data-Informed Facilitators**. Think of these educators as the conductors of the data orchestra. They are trained to guide faculty conversations, ensuring that data dialogue remains objective and strictly focused on instructional decisions, keeping the team on track without getting lost in debate.
Finally, we have **Mapping Coaches**. These are the tech-savvy peers who act as mentors. By being given release time from their own classrooms, they focus entirely on helping colleagues master software entry and quality map construction, ensuring everyone is building their curriculum on a solid foundation.
When these three roles come together, they create a self-sustaining culture where every educator is both a leader and a learner, driving the school forward through shared expertise rather than top-down mandates.

Look at this blueprint of an empty chair. It represents the ultimate goal of all our data: Chris, the student. Whether we are looking at our curriculum, assessment results, or school culture, every single decision must pass through one filter: Is this in Chris's best interest?
If our conversations start drifting toward adult convenience or administrative ease, that empty chair redirects our focus back to what matters most—student learning. This visual reminds us that data isn't just about numbers; it's about ensuring that every piece of evidence we collect and every strategy we implement serves the student sitting in that chair.

Imagine a grid where every educational decision finds its perfect coordinate. On this slide, we see exactly that: a powerful "Standard Unpacked" matrix that aligns what we teach with how we assess it. Look at the axes: the vertical line represents our cognitive skills—moving from simple understanding to complex evaluation—while the horizontal line maps our specific content, like fractions, scientific notation, or literary devices.
In our example, the yellow dot sits precisely at the intersection of "Compare" and "Fractions." This isn't just a random placement; it tells a clear story. The standard we are unpacking is to "represent fractions in equivalent forms," which requires students to use their content knowledge of fractions to perform the skill of comparing them. The slide reminds us of a crucial rule: both the content and the skill must align directly with our chosen assessment method. If we want students to compare fractions, our test questions must ask them to do exactly that, not just list them.
This alignment is the heartbeat of a data-driven culture. When our curriculum, our teaching skills, and our assessments all converge on the same point, we eliminate the guesswork. Teachers know exactly what to teach, and assessments accurately measure if students have truly mastered the standard. By visualizing this connection on a map like this one, we transform abstract goals into actionable, measurable steps for every classroom.

The Assessment Ecosystem Matrix on your screen breaks down the three critical data sources that drive modern education: State Assessments, Local Benchmarks, and Classroom Data. Let's look at how they differ and why using all three is essential.
State Assessments are annual events designed primarily for accountability and setting strategic targets. However, because they happen once a year, there is often a significant data lag—sometimes taking months to get results. This makes them summative; they tell us what happened in the past, but they often feel disconnected from daily teaching, leading to low credibility among teachers who can't use them to fix immediate problems.
Local Benchmarks offer a middle ground. Conducted quarterly, they help monitor systemic progress across the district. The data lag here is reduced to days or weeks, making it predictive rather than purely summative. While still not perfect, these benchmarks offer moderate to high credibility because they align more closely with the district's timeline and goals.
Finally, we have Classroom Data. This is the engine of daily learning and coaching. It's collected daily or weekly, meaning there is no data lag at all—it's immediate and formative. Because teachers own this data and use it right in their classrooms, it has very high credibility. It allows for real-time adjustments to instruction.
The key takeaway from this matrix is that no single data source tells the whole story. We need the long-term perspective of state tests, the district-wide monitoring of local benchmarks, and the real-time feedback from the classroom. Only by balancing all three can we move from reacting to past results to actively shaping future student success.
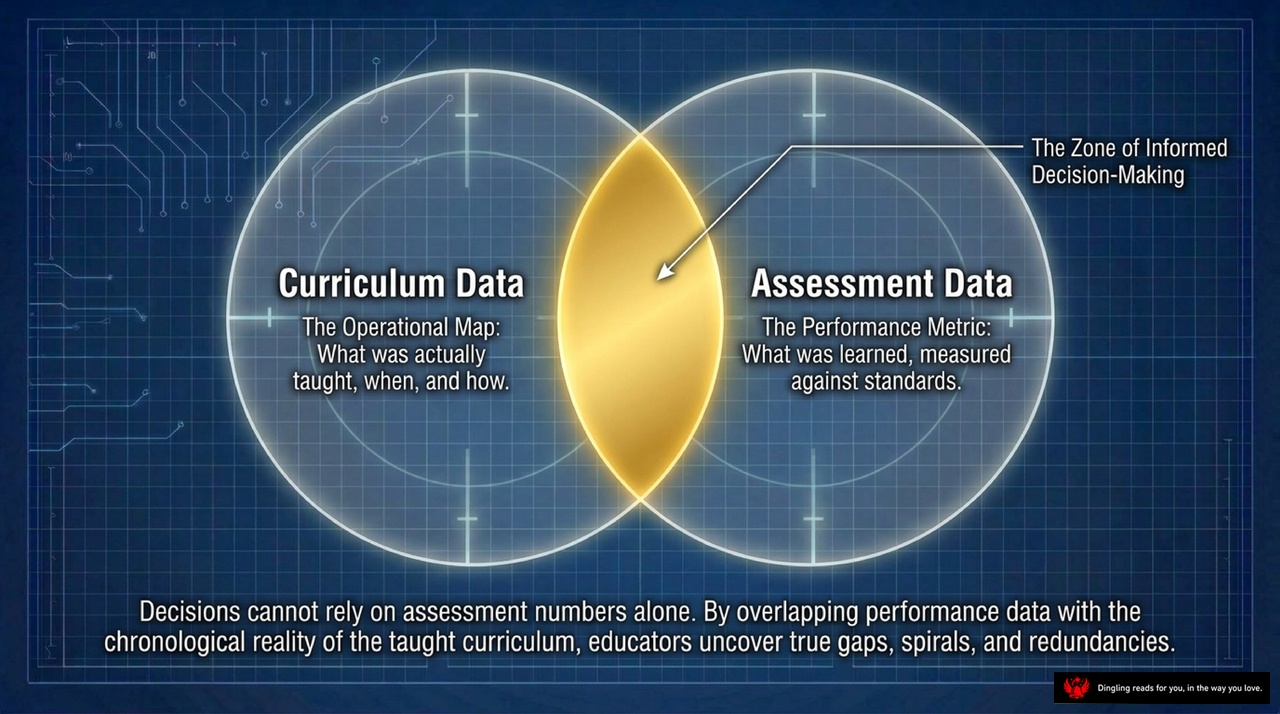
In this Venn diagram, we see the critical intersection that defines true educational decision-making. On the left, we have "Curriculum Data," which serves as the operational map—telling us exactly what was taught, when, and how. On the right sits "Assessment Data," the performance metric that measures what students actually learned against specific standards.
The magic happens in the golden overlap: "The Zone of Informed Decision-Making." This is where the reality of the classroom meets the results of the tests. As the text at the bottom emphasizes, decisions cannot rely on assessment numbers alone. When educators overlap performance data with the chronological reality of the taught curriculum, they uncover the truth. They can finally spot the real gaps in learning, identify where spirals have failed, and detect redundancies that waste time. By connecting what we planned to teach with what students actually mastered, we move from guessing to knowing, ensuring every instructional minute counts.
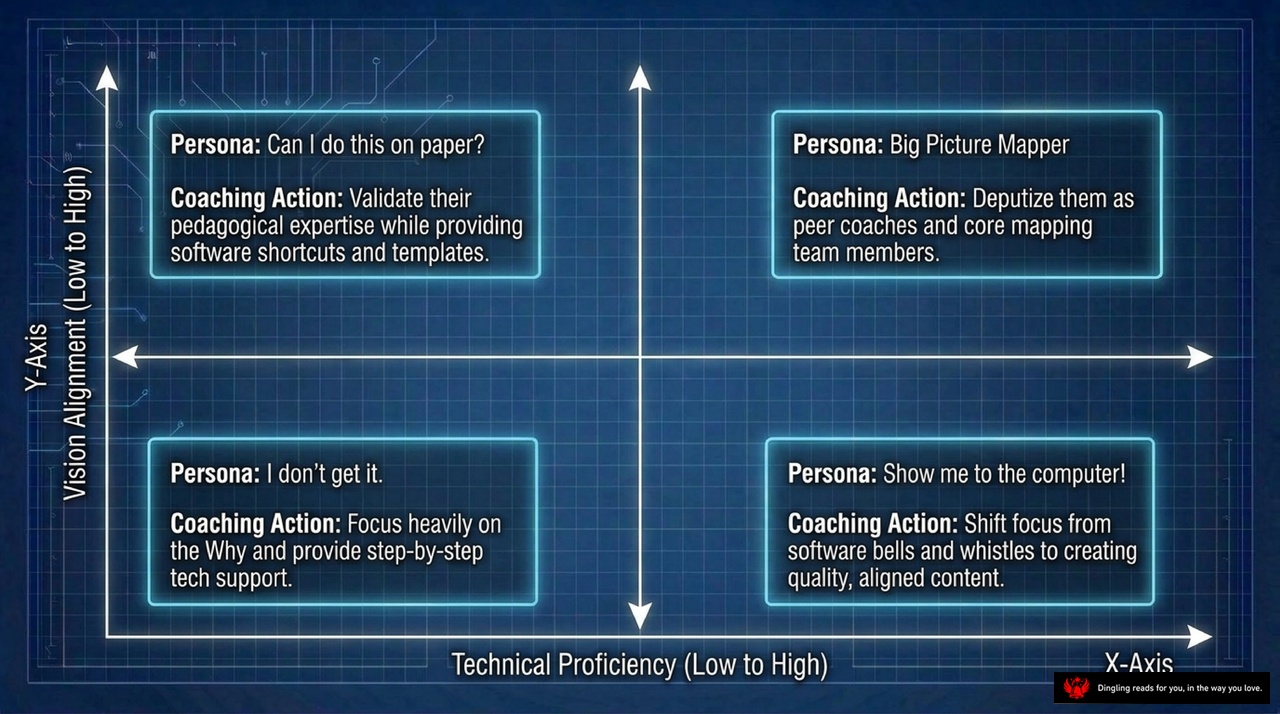
Imagine a classroom where every teacher feels uniquely understood, not just as an employee, but as a distinct learner with specific needs. Today's slide breaks this concept down into four clear quadrants based on two critical factors: how well a teacher aligns with our school's vision, and how comfortable they are with technology.
In the top right, we have our "Big Picture Mappers." These are our visionaries who already grasp the strategy and love the tech. Our coaching action here is simple: empower them. Deputize them as peer coaches and core mapping team members. Let them lead the charge.
Moving to the top left, we find teachers who ask, "Can I do this on paper?" These educators have the pedagogical expertise and buy-in, but they struggle with the tools. For them, we validate their teaching skills while providing the software shortcuts and templates they need to succeed.
Now, look at the bottom right. These teachers are tech-savvy—they want to jump straight to the computer—but they don't yet see the "why" behind our data-driven culture. Our job here is to shift their focus away from just clicking buttons and toward creating quality, aligned content that actually moves students forward.
Finally, in the bottom left, we have the group that says, "I don't get it." They lack both vision alignment and technical skills. For these teachers, we must focus heavily on the "why" to build understanding, paired with step-by-step technical support to build their confidence. By tailoring our approach to each of these personas, we ensure no one gets left behind in our transformation.

The Protocol Cycle isn't just a diagram; it's the heartbeat of a truly data-driven school. Look at the three steps here: Prediction, Analysis, and Action.
First, we start with **Prediction**. Before we even look at a single data point, teachers make an educated guess about student performance based on benchmarks. Why do we do this? Because surfacing these biases and anchoring our expectations early is crucial. It forces us to confront our assumptions before the data confirms or challenges them.
Next, we move to **Analysis**. This is where we compare those predictions against actual student performance. It's not just about looking at numbers; it's about establishing strong group norms. We practice listening with empathy, manage our impulsivity, and engage in problem-posing. We ask, "Why did the data surprise us?" or "Why did it match our expectations?"
Finally, we arrive at **Action**. Here, we cross-reference our areas of concern with our curriculum maps. This allows us to identify specific instructional gaps—where we taught but students didn't learn, or where we haven't taught at all. The result? Collaborative redesign. We adjust our teaching strategies in real time to close those gaps.
This cycle repeats continuously, ensuring that our data doesn't just sit in a report, but actively drives the decisions we make every day in the classroom.

Imagine the school as a sophisticated, multi-layered lens, where every level of leadership focuses the light of data onto a specific part of the curriculum. At the widest angle, superintendents and principals aren't just looking at test scores; they are scanning multi-year trends across the entire district to spot systemic gaps and allocate resources where they matter most. Zooming in to the mid-range, building leaders and department chairs dive deeper, using PLCs to analyze benchmark cohorts and fine-tune pacing maps so that instruction flows smoothly from grade to grade. Finally, at the macro focus right in the classroom, individual teachers use their personal diary maps to scrutinize specific student work, differentiating their instruction for tomorrow based on real-time evidence. This three-tiered approach ensures that data isn't just collected—it's actively used to align the vision from the top down to the very last lesson taught, turning raw numbers into a coherent path for student success.
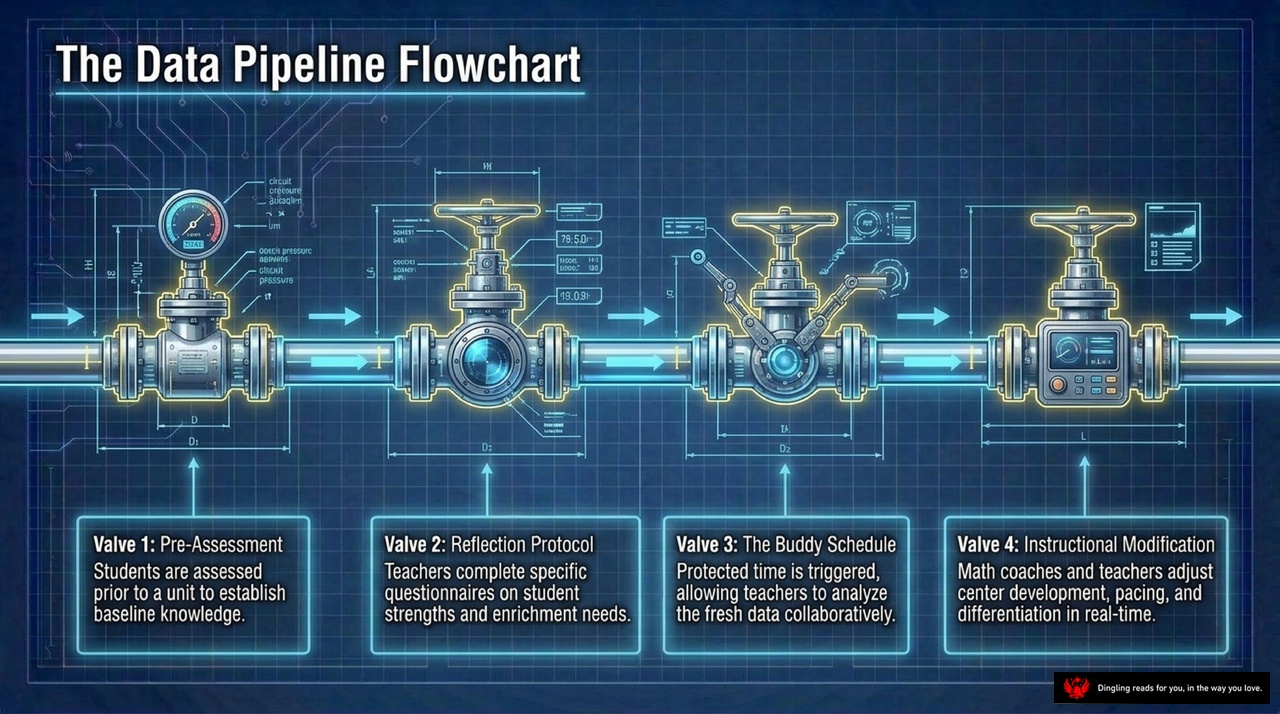
Look at this "Data Pipeline Flowchart." Think of the entire school year not as a linear race, but as a sophisticated water system where data flows through four critical valves to ensure every student gets the support they need.
First, we have Valve 1: Pre-Assessment. Before we even dive into a new unit, we stop to check the pressure gauges. We assess students to establish a baseline, knowing exactly where they stand before we start teaching.
Next, Valve 2: The Reflection Protocol. This is where teachers pause to complete specific questionnaires. We're not just looking at scores; we're analyzing student strengths and identifying exactly where enrichment is needed.
Then comes Valve 3: The Buddy Schedule. This triggers protected time for collaboration. Teachers come together to analyze this fresh data, turning individual observations into collective insights.
Finally, Valve 4: Instructional Modification. This is the action phase. Math coaches and teachers adjust the center development, pacing, and differentiation in real-time based on what the data tells them.
By keeping these four valves open and flowing smoothly, we transform data from a static report card into a dynamic engine that drives immediate, meaningful improvements for every learner.

Welcome back. Today, we're diving into the "Interactive Maturity Model," a powerful framework that visualizes exactly where your school stands on its journey from a reactive institution to a truly data-driven powerhouse.
As you can see, the model is broken down into five distinct stages: Initial, Prologue, Getting Started, Advanced, and Established. Think of this not just as a chart, but as a roadmap for cultural transformation. We aren't just looking at isolated improvements; we are tracking the evolution of four critical pillars: Mapping, Assessment, PLCs, and Technology.
Let's start with **Mapping**. In the early stages, curriculum mapping is often fragmented, relying on individual diary maps that reflect only a single teacher's perspective. But as we move toward the Advanced and Established levels, that shifts dramatically. We evolve from those isolated notes to district-wide consensus maps. This means everyone is speaking the same language, ensuring that what is taught in Grade 3 seamlessly connects to Grade 4, eliminating gaps and redundancies across the entire system.
Next, look at **Assessment**. Initially, assessments are often isolated tests, treated as a separate event that happens after the fact. They feel disconnected from the daily classroom experience. However, in a mature data-driven culture, assessment becomes embedded and predictive. It transforms from a "rear-view mirror" that only tells us what happened last year into a "steering wheel" that guides our instruction in real-time. We use benchmarks and state-level data not just to grade students, but to adjust our teaching strategies immediately.
Then there are our **PLCs**—Professional Learning Communities. In the beginning, these meetings can feel fragmented, often devolving into generic discussions or administrative check-ins. But in the Advanced stages, PLCs become systemic and data-driven. Teachers gather specifically to analyze student data, share strategies, and solve problems together. It shifts from "teaching in silos" to a culture of collective inquiry where every teacher is a researcher in their own classroom.
Finally, consider **Technology**. At the start, technology is often just about basic entry—digitizing paper forms or storing files. But true maturity looks different. It moves toward epistemic operational models. This means technology isn't just a tool for storage; it's an integrated system that connects our curriculum maps with our assessment data. It allows us to visualize patterns, predict student needs, and make informed decisions instantly, rather than waiting for end-of-year reports.
The golden marker on this timeline, right in the "Getting Started" phase, represents that pivotal moment where these four pillars begin to align. It's where we stop doing things in isolation and start working as an integrated system. The goal isn't just to collect more data, but to create a culture where data drives every decision, from the curriculum we design to the interventions we provide. By aiming for that Established stage, we ensure that our educational system is resilient, responsive, and truly focused on the success of every single student.

Look at this field report from the West Seneca Central School District. It perfectly illustrates how a school district can turn chaos into clarity.
The challenge was clear: over 200 teachers leaving every year, and a deep resistance to top-down mandates. Teachers felt overwhelmed and unheard. But instead of fighting harder, the district made a tactical pivot. They waived traditional lesson plan book requirements for those who participated in curriculum mapping. This simple move immediately reduced the administrative overload, giving teachers back their time.
Then came the tech integration. They utilized a Curriculum Analyzer tool to cross-reference Comprehensive Assessment of Reading Strategies data directly against mapped teaching frequency. This generated an epistemic operational model, turning vague guesses into precise, data-driven decisions. By connecting the dots between what they teach and what students learn, West Seneca proved that when you align your curriculum with your assessment, you stop guessing and start growing.
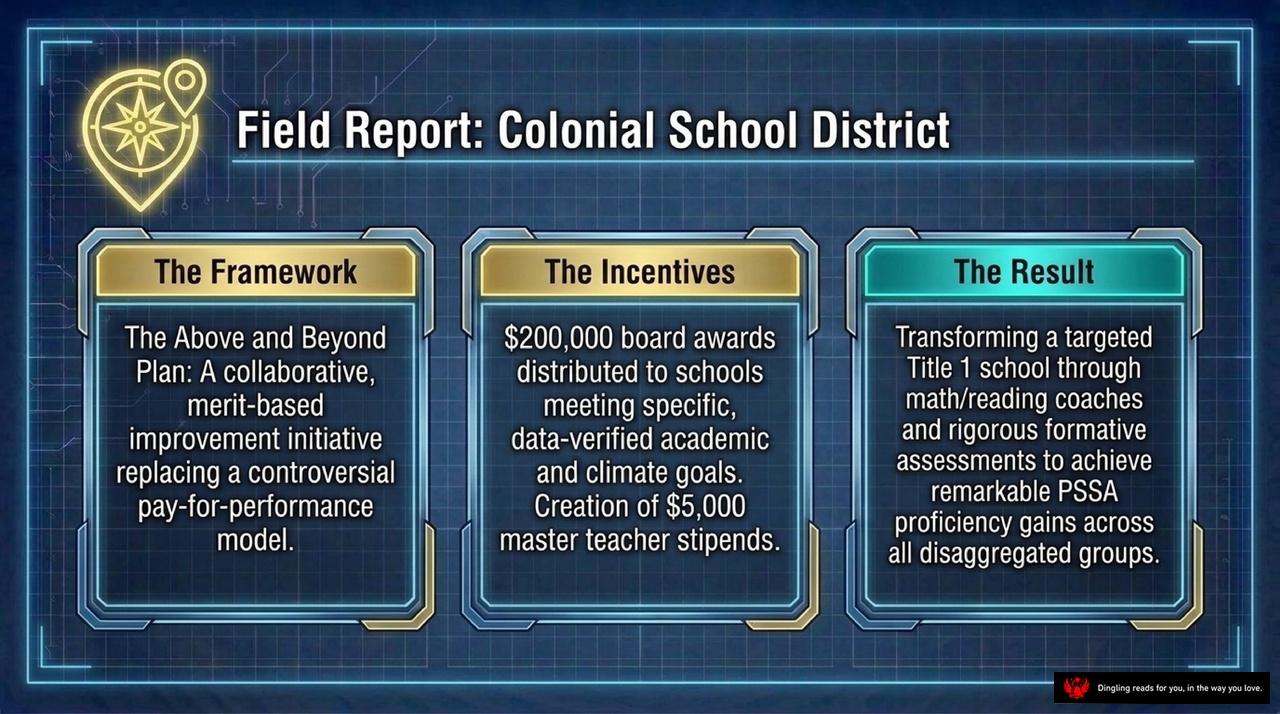
Field Report: Colonial School District. Here is how they turned a struggling Title 1 school into a high-performing powerhouse.
It all started with a shift in mindset. Instead of the controversial, high-pressure pay-for-performance model that often breeds fear, they launched the "Above and Beyond" Plan. This was a collaborative, merit-based initiative focused on genuine improvement.
To make it work, they built a powerful incentive structure. The school board allocated $200,000 in awards, distributed directly to schools that met specific, data-verified academic and climate goals. They also created $5,000 stipends for master teachers, empowering them to lead and mentor their colleagues.
The result? Remarkable transformation. By deploying math and reading coaches and using rigorous formative assessments, they didn't just improve the average—they lifted every single group. The data shows significant PSSA proficiency gains across all disaggregated groups, proving that when you align incentives with collaboration and clear goals, you can achieve equity and excellence simultaneously.

Field Report: West Chester East High School. Here, we see the evolution of a school culture transformed from isolated classrooms into a unified learning system.
Over five years, West Chester East moved away from independent teaching silos to create cohesive consensus maps. This shift was catalyzed by utilizing full-day, in-service small group reviews mixed across disciplines. By breaking down departmental walls, the school fostered true cross-pollination of ideas, ensuring that no single subject dominated the curriculum.
The ultimate achievement? Integrating a massive literacy across the curriculum initiative directly into mapping software. This proved that mapping isn't just a temporary project, but the permanent umbrella under which all other educational initiatives live. It's a powerful reminder that when teachers collaborate across disciplines, the result is a curriculum that truly serves every student.

Navigating Change: Your Five-Point Compass for School Success
Look at this strategic framework we've built together. When we talk about **navigating change** in education, we aren't just hoping for the best; we are actively steering our schools through uncertainty. This diagram outlines exactly how to keep our vision alive while adapting to the inevitable shifts in administration, technology, and student needs.
First, let's talk about **Distributing the Leadership**. We need to stop relying on a single charismatic leader. If the entire burden rests on one person, the moment they leave, the momentum dies. Instead, we must empower teacher-leaders. We need to build a culture where everyone owns the vision, not just the administration.
Next, we must **Monitor the Feedback Spiral**. Think of resistance not as mutiny or rebellion. It is actually necessary data. When teachers push back or struggle, that is valuable information telling us where our plan needs refinement. We treat every challenge as a checkpoint for continuous improvement.
Then, we have to **Align the Resources**. This is about making sure our technology infrastructure and our professional development time actively support the vision we've set. If we buy great tools but don't give teachers the time to learn them, the vision fails. Our resources must match our goals.
We also need to **Leverage the Action Plan**. Keep these plans brief and task-managed. Anchor everything to SMART goals. Why? Because we are preparing to survive administrative turnover. If our work is tied to rigid, short-term mandates, we will be wiped out when leadership changes. But if our work is built on solid, actionable goals, it endures.
Finally, and most importantly, we must **Preserve the Core**. We need to maintain timeless educational values—like equity and student growth—while relentlessly adapting our operating strategies. The *what* stays the same; the *how* evolves.
By following these five steps, we ensure that our school doesn't just survive change, but thrives through it.

On the left, we see a delicate pocket watch labeled "Time Telling"—implementing initiatives to solve today's distinct problems. On the right stands the iconic Big Ben, representing "Clock Building": creating permanent cultural and technological architecture designed to outlast any single leader and continuously drive student achievement.
The core message here is clear: mapping and data analysis are not just temporary fixes; they are the permanent architecture of the institution.
Think about it this way. "Time Telling" is what we've often done in the past—reacting to immediate crises, patching up problems as they arise, or relying on a single leader's intuition to steer the ship. It's about solving today's distinct problems. But this approach leaves the school vulnerable. If that leader leaves, or if the crisis changes, the entire system can wobble.
In contrast, "Clock Building" is about constructing something enduring. It's about shifting from temporary repairs to building a robust foundation. This means embedding data literacy into the very DNA of your school, not as an add-on, but as the core operating system. When you build this way, you create a culture where every teacher, regardless of who is in charge, understands how to use data to inform instruction. You build systems that align curriculum and assessment so seamlessly that gaps and redundancies disappear on their own.
The pocket watch measures the moment, but the clock tower measures the legacy. By choosing to build the clock, you ensure that your school's success isn't tied to a person, but to a resilient, self-sustaining culture that drives student achievement year after year.

True educational transformation isn't magic; it happens at the intersection of three powerful forces: operational curriculum maps, targeted assessment data, and a deeply collaborative professional culture. Think of it as the perfect triangle where every side supports the others. Without the map, you don't know where you're going. Without the data, you can't see if you're on track. And without collaboration, no single teacher can fix the gaps alone.
Here's the hard truth: your organization is generating data every single day. But ask yourself—are you using it merely to report on the past, or are you actively mapping the blueprint for your students' future? Too often, we fall into the trap of using assessment as a rear-view mirror, looking back at what happened instead of using it as an engine to drive forward. True change requires shifting from that passive reflection to an active strategy where data informs every decision, ensuring we aren't just teaching to the test, but truly preparing our students for what's next.