
A Monetary History of the United States: Complete Chapter-by-Chapter Summary

Welcome to the definitive story of how America's money shaped its destiny. Today, we are diving into a century of financial history, spanning from 1867 to 1960. Why start in 1867? Because that is the first year we have continuous data on the nation's money supply, marking the end of the chaotic post-Civil War era where state banks lingered long after they should have vanished.
This book, *A Monetary History of the United States*, by Milton Friedman and Anna J. Schwartz, reveals a powerful truth: the invisible hand of the money stock is the ultimate dictator of national prosperity. Look at the rising gold line on our cover—it represents a century of data proving that when money expands, the economy grows; when it shrinks, the nation suffers.
Consider the Greenback era from 1867 to 1879. While prices plummeted by half due to deflation, the economy actually boomed. Railroads doubled, coal and iron production skyrocketed, and the population surged. It was a paradox that shattered conventional wisdom: deflation and prosperity coexisted. But the political battle was fierce. Farmers and workers demanded expansion to raise prices, while eastern bankers fought to restore the gold standard. It wasn't until 1879, after years of turmoil and legal battles, that the U.S. finally returned to a gold-backed currency.
However, stability was fleeting. The Panic of 1907 exposed the fragility of the banking system, leading directly to the creation of the Federal Reserve in 1914. But the 1920s, often romanticized as a golden age, hid a ticking time bomb. The Federal Reserve made critical errors in managing the money supply, inadvertently sowing the seeds for the Great Depression. When the crash hit in 1929, the money supply collapsed by a third, dragging the economy into the darkest decade in American history.
The New Deal that followed didn't just fix banks; it fundamentally changed the nature of money itself. By ending the gold standard and introducing deposit insurance, the U.S. transitioned from a system tied to physical assets to a modern credit-based economy. This shift, along with the lessons learned from the 1937 recession and the post-war period, set the stage for the stable growth we see today.
Ultimately, this century teaches us one lesson: the relationship between money and the economy is far more complex and powerful than we ever imagined. What looks like a stable system on paper can collapse overnight if the money supply is mismanaged. The rise and fall of American prosperity is written in the numbers of our money supply.

Tracing a century of data reveals the true driver of economic cycles. For too long, we've been told that economic ups and downs are driven by inevitable, non-monetary forces—that technology, population, or politics alone dictate our fate. But the reality is far more powerful and precise. Changes in the money stock have an independent, profound, and stable relationship with economic conditions, incomes, and prices.
By isolating nearly a century of data from 1867 to 1960, we can see this truth clearly. This specific window allows us to isolate the monetary factor across drastically changing political and economic landscapes, stripping away the noise to find the signal.
Think of it this way: when we look at the "Myth," we see a world where money is just a passive backdrop to real economic activity. But when we look at "The Reality," we see that money is actually the engine. Whether it was the deflationary gold standard of the late 19th century, the volatile expansion of the 1920s, or the catastrophic contraction of the Great Depression, the common thread is always the same. When the money supply shrank, the economy collapsed. When the money supply grew, the economy recovered.
This isn't just about accounting; it's about understanding the fundamental mechanism of our economy. By debunking the myth that non-monetary forces are the primary drivers, we unlock the ability to understand—and eventually, to navigate—economic cycles with clarity. The data from the last hundred years leaves no room for doubt: the money supply is the true driver.

Imagine the entire money supply as a complex machine, driven by three interlocking gears. Today, we're looking at how these gears work together to determine the total volume of money in the economy.
The first and largest gear is High-Powered Money, or H. Think of this as the foundation of the system. It includes the cash you hold plus the reserves banks keep in the vault. This base is controlled by the government and the central bank, setting the stage for everything that follows.
The second gear is the Deposit-Reserve Ratio, or D/R. This is where commercial banks come in. They decide how much of their deposits they keep as reserves versus how much they lend out. By controlling this ratio, banks dictate how much new money gets created through the lending process. It's the engine that multiplies the initial high-powered money.
The third gear is the Deposit-Currency Ratio, or D/C. This one is controlled by the public. It reflects how much trust people have in the banking system. If you trust the bank, you leave your cash there, keeping the money in the system. If you lose that trust, you pull your cash out, draining it from the system. This ratio determines how much high-powered money leaks out as physical cash versus staying as bank deposits.
When these three gears turn in sync, they drive the Total Money Stock. It's a delicate balance: the government sets the base, banks decide how much to expand it, and the public decides how much to keep in the system. Understanding how these forces interact is key to understanding the economy.

The slide highlights a pivotal shift in American economic history: the transition from the chaotic Greenback Era to the structured Gold Inflation Era. On the left, you see the Greenback Era, spanning from 1867 to 1879. During this time, the U.S. operated under a Fiduciary Standard. This meant our high-powered money wasn't tied to a physical commodity like gold; instead, it was determined purely by domestic political actions and flexible exchange rates. The image of the Capitol building illustrates this perfectly—policy was driven from within, allowing for significant flexibility in how the money supply was managed.
Contrast that with the right side: The Gold Inflation Era, running from 1897 to 1914. Here, the rules changed completely. We adopted the International Gold Standard. Now, high-powered money was tethered to the physical movement of gold and international trade balances. The illustration of the ship and the gold bar captures this reality—our currency was no longer just a domestic tool; it was linked to the global flow of bullion. If gold flowed in, our money supply grew; if it flowed out, it shrank.
The key insight at the bottom sums it all up. Under flexible exchange rates, domestic policy ruled the roost. But once we locked onto gold, the U.S. money supply was violently subjected to global forces. We lost the ability to control our own destiny and became at the mercy of international trade balances and gold shipments. This shift fundamentally altered how the American economy functioned, moving it from an internally managed system to one deeply integrated into the volatile currents of the global financial system.

The Federal Reserve was born with a noble mission: to replace rigid, automatic market adjustments with human discretion, creating an "elastic currency" capable of absorbing shocks and fueling trade. But as this slide starkly illustrates, the gap between that intent and reality has been profound. On the left, we see the ideal—a decentralized web where the market naturally balances itself. On the right, we see the actual outcome: a dangerous shift where the complex machinery of the economy now hinges entirely on the discretionary judgment of a few individuals.
This transition wasn't seamless. The early test of this new system, from 1920 to 1921, revealed the inherent dangers of centralized control. When the Fed faced pressure, it reacted with delayed, drastic interest rate hikes designed to protect gold reserves rather than stabilize the economy. This rigid response triggered a severe contraction, proving that removing the automatic stabilizers of the market and replacing them with human judgment can be far more destructive than the chaos it was meant to solve.

The slide clearly illustrates a terrifying downward spiral. Between 1929 and 1933, the total U.S. money stock didn't just dip; it collapsed by exactly one-third. This wasn't a gentle correction; it was a catastrophic hemorrhage of liquidity.
And the consequences were immediate and brutal. As that money vanished, wholesale prices plummeted by over 30%, wiping out business value across the nation. With no money to buy goods, industrial production simply collapsed. Factories shut down, and the economy ground to a halt.
But here is the most critical takeaway from this chart: this wasn't an inevitable economic purge. It wasn't a natural law that had to happen. The text at the bottom makes it clear—this was a tragic failure of monetary policy. The Federal Reserve had the tools to counteract this severe liquidity crisis, but instead of injecting the necessary reserves to stop the bleeding, they failed to act. They watched the money supply evaporate, allowing a manageable recession to transform into the greatest depression in American history. The collapse of the money stock didn't just reflect the economy's troubles; it actively created them.

The Federal Reserve fundamentally misread the economic indicators, and this slide captures the tragic disconnect between what they saw and what was actually happening. On the left, under "The Fed's Perception," the story is one of false comfort. The Fed believed money was "easy" simply because nominal interest rates were historically low. They also pointed to "excess" reserves sitting in banks as a sign of liquidity, and they viewed bank failures as a necessary cleansing of bad management, essentially hoping the system would fix itself.
But look at the stark reality on the right, labeled "The Macro Reality." While the Fed saw ease, the truth was that money was incredibly "tight." The total money stock was actually plummeting, and real interest rates were punitive, crushing economic activity. Here is the crucial insight: those "excess" reserves the Fed celebrated were not a surplus of liquidity. They were a desperate attempt by surviving banks to hoard cash against future panics. Instead of lending out that money to fuel growth, banks were hiding it, which is exactly why the money supply collapsed. The Fed mistook a symptom of fear for a sign of health, and that fundamental misreading of the data helped accelerate the economic collapse.

Imagine a bank run not as a sudden panic, but as a self-perpetuating engine of destruction. This slide captures the terrifying logic of a "vicious feedback loop" that can drain liquidity from the entire banking system, leading straight to systemic collapse.
It all starts with **Step 1: Panic**. When the public loses faith in a bank, they rush to withdraw their cash. This triggers **Step 2: Hoarding**. As people demand physical currency instead of keeping money in bank accounts, the Deposit-to-Currency ratio plummets. Banks, suddenly stripped of their reserves, are forced into **Step 3: Contraction**. To survive, they violently call in loans and sell off assets, which further drains the system's money supply.
But here is the fatal flaw in the cycle: **Step 4: The Void**. Because the Federal Reserve fails to inject enough high-powered money to meet this exploding demand for cash, the hole keeps getting bigger. Without fresh liquidity, the panic feeds on itself, turning a localized run into a total **Systemic Collapse**. This diagram reminds us that in a fragile financial system, a loss of confidence isn't just a symptom—it's the trigger that can shut down the entire economy.

Imagine a scenario where a well-intentioned policy decision backfires spectacularly, triggering the very crisis it was meant to prevent. This is exactly what happened in the United States between 1936 and 1937, a pivotal moment that reshaped our understanding of banking and economic stability.
Look at the graph on your screen. It tracks bank reserves over time, showing a steady climb from 1933 all the way to a peak in 1936. But then, right around 1937, the curve takes a sharp, dangerous plunge. Why did this happen? The culprit was the Federal Reserve's misinterpretation of bank behavior.
Fearing that the growing "excess" reserves held by banks would fuel inflation, the Fed made a drastic move. Between 1936 and 1937, they abruptly doubled reserve requirements. Their logic was sound on paper: reduce excess liquidity to cool the economy. However, they completely misunderstood the psychology of the banks.
As the slide highlights under "The Consequence," these banks didn't view those reserves as "excess" money sitting idle. Instead, after the trauma of the 1933 banking collapse, they saw those reserves as a necessary shock absorber—a critical safety cushion against future runs. When the Fed stripped away this cushion by forcing banks to hold more reserves, the banks panicked. They violently contracted credit, pulling money out of the economy just when it was needed most.
This self-inflicted wound directly triggered the severe 1937-1938 economic relapse. The lesson here is timeless: treating precautionary liquidity as inflationary excess can destroy the very stability you are trying to protect. In finance, sometimes the most dangerous action isn't doing nothing, but doing the wrong thing at the wrong time.

Look at this bar chart. It tells a stark story about the cost of going to war. The title says it all: wartime financing surrendered monetary independence to peg interest rates.
On the left, under "Financing the War," we see the mechanism. To fund the massive deficit, the Federal Reserve gave up its independence. It agreed to buy unlimited government bonds. Why? To artificially peg interest rates low and make borrowing cheap for the Treasury.
But look at the result on the right. This policy had a direct, explosive consequence. High-powered money expanded drastically, fueling wartime inflation. Notice how the bars climb steeply? That volume of money wasn't dictated by economic needs or stability; it was entirely dictated by the Treasury's borrowing needs.
In short, by trying to manage interest rates to fund the war, the Fed lost control of the money supply, and the result was a surge in inflation that completely detached the currency from macroeconomic stability.

Have you ever noticed how money seems to move faster and faster in the modern economy? This slide reveals a fascinating historical trend: from the moment the U.S. emerged from World War II, the velocity of money didn't just fluctuate—it rose steadily, climbing in lockstep with interest rates over the following decades.
The chart clearly shows two lines moving upward together. The dark blue line represents Monetary Velocity, while the yellow line tracks Interest Rates. Starting from the post-1945 era, both metrics show a consistent, sustained rise. This wasn't a random glitch; it was a fundamental shift in how Americans interacted with cash.
Why did this happen? The slide highlights two powerful drivers. First, the financial landscape changed. The development of close monetary substitutes—like savings and loan shares—gave people better options than holding physical cash. They didn't need to keep as much money under the mattress or in low-yield accounts anymore. Second, and perhaps more importantly, public expectations shifted. After the chaos of the Great Depression, people developed a profound belief in long-term economic stability. Because the economy looked secure, individuals and businesses felt less need to hold large precautionary cash balances just to be safe.
This shift meant money circulated more efficiently. Instead of sitting idle as a safety net, it was deployed into the economy, fueling growth and investment. So, while interest rates were climbing, the very speed at which money turned over the economy accelerated even faster, creating a dynamic that defined the post-war American boom.

Look closely at this image. You see the words "MONEY STOCK" in the background, but a magnifying glass is zooming in on just one small part: "Interest Rates." The slide makes a bold claim: nominal interest rates are a deceptive gauge for monetary policy. In fact, relying on them is the single greatest error in the history of central banking.
Why is this so dangerous? Because low interest rates do not automatically mean easy money. This is a critical distinction that history has taught us time and again. Take the Great Depression as a prime example. During that era, interest rates were historically low. But instead of signaling a booming economy, those low rates simply reflected a collapsed demand for credit and plummeting prices. They were hiding the ugly reality of a violently contracting money supply.
The lesson here is profound: you cannot judge the stance of monetary policy just by looking at the headline interest rate. You have to look at the underlying money stock. If the money supply is shrinking, even with low rates, the economy is in deep trouble. Conversely, an economy can be overheating even if rates aren't sky-high. This slide is a warning to stop being fooled by superficial numbers and to focus on the real driver of economic health: the actual amount of money in circulation.
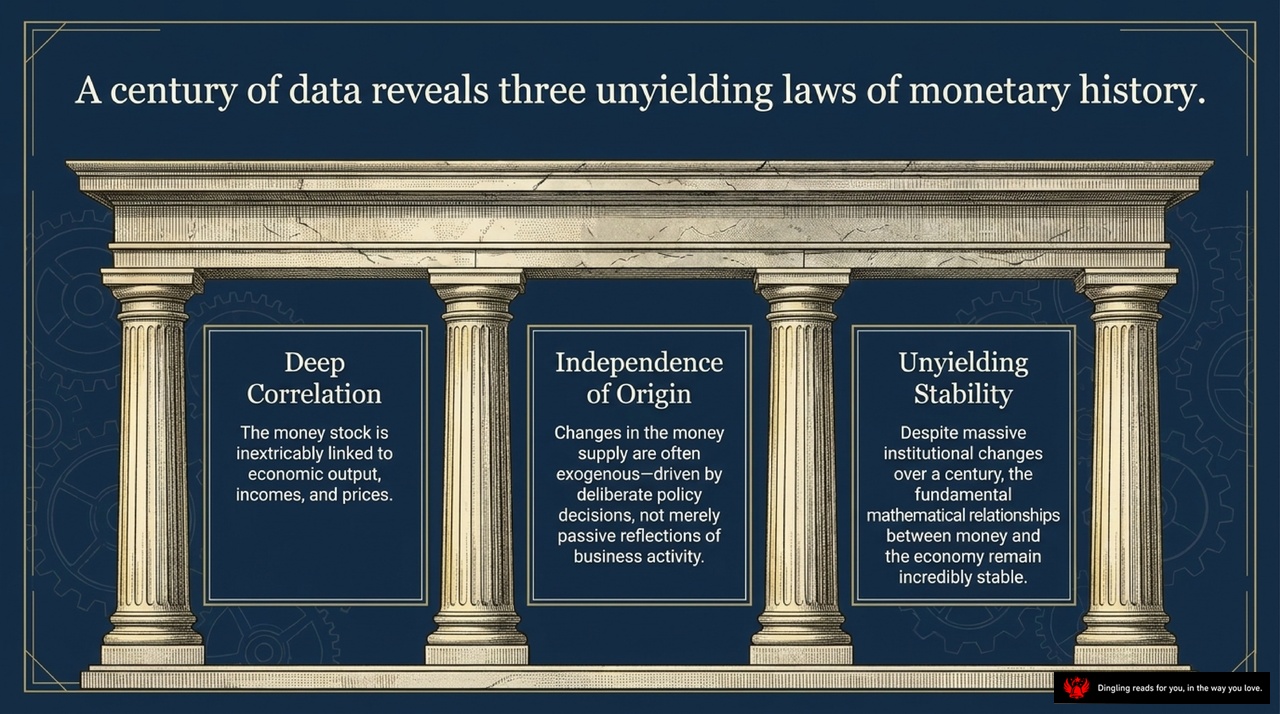
A century of hard data reveals three unyielding laws of monetary history that hold true regardless of the era or the political regime.
First, there is Deep Correlation. The money supply isn't an isolated variable; it is inextricably linked to economic output, incomes, and prices. When money grows, the economy expands. When it shrinks, the economy contracts. This relationship is a fundamental constant.
Second, consider the Independence of Origin. Changes in the money supply are often exogenous—driven by deliberate policy decisions by central banks and governments, rather than merely being a passive reflection of business activity. The Fed doesn't just react to the economy; its actions actively shape it.
Finally, we have Unyielding Stability. Despite massive institutional changes over the last hundred years—from gold standards to fiat currencies, from the Federal Reserve's creation to the Great Depression—the fundamental mathematical relationships between money and the economy remain incredibly stable.
These three laws remind us that while the tools we use to manage money change, the underlying mechanics of the economy remain remarkably consistent.

For nearly a century, the story of the U.S. economy wasn't written by nature's cycles, but by the mechanical swings of money supply and the fallible humans pulling the levers. As the slide suggests, true stability doesn't come from the discretionary whims of authorities, but from steady, predictable money growth.
Think about the lessons from 1867 to 1960. We saw how misreading the monetary gauge birthed our greatest disasters. From the deflationary boom of the Greenback era to the gold standard's rigidities, and finally the catastrophic policy errors of the Great Depression, history shows us a pattern: when policymakers fail to understand the mechanics of money, the economy pays the price.
So, are today's policymakers reading the gauge any better? Or are we simply waiting for history to rhyme? The data from the last 100 years is clear: economic stability relies on getting the money right, not on hoping for the best.