
Principles for Navigating Big Debt Crises: Complete Chapter-by-Chapter Summary
Welcome to today's deep dive into the mechanical patterns of the global economy. We are exploring the work of Ray Dalio, specifically his framework for understanding "Big Debt Crises." Think of the global economy not as a chaotic mess, but as a complex machine with predictable gears and levers.
This slide introduces the core promise of that framework: it provides a blueprint for navigating financial disasters. Whether you are looking at the 2008 crisis or historical events like the German hyperinflation, the underlying logic remains the same. By recognizing the anatomy of these financial disasters—the shift from a healthy debt cycle to a destructive one—we can understand exactly how crises form and, more importantly, how to navigate them when they arrive. Today, we will unpack this template to see how it applies to real-world economic cycles.
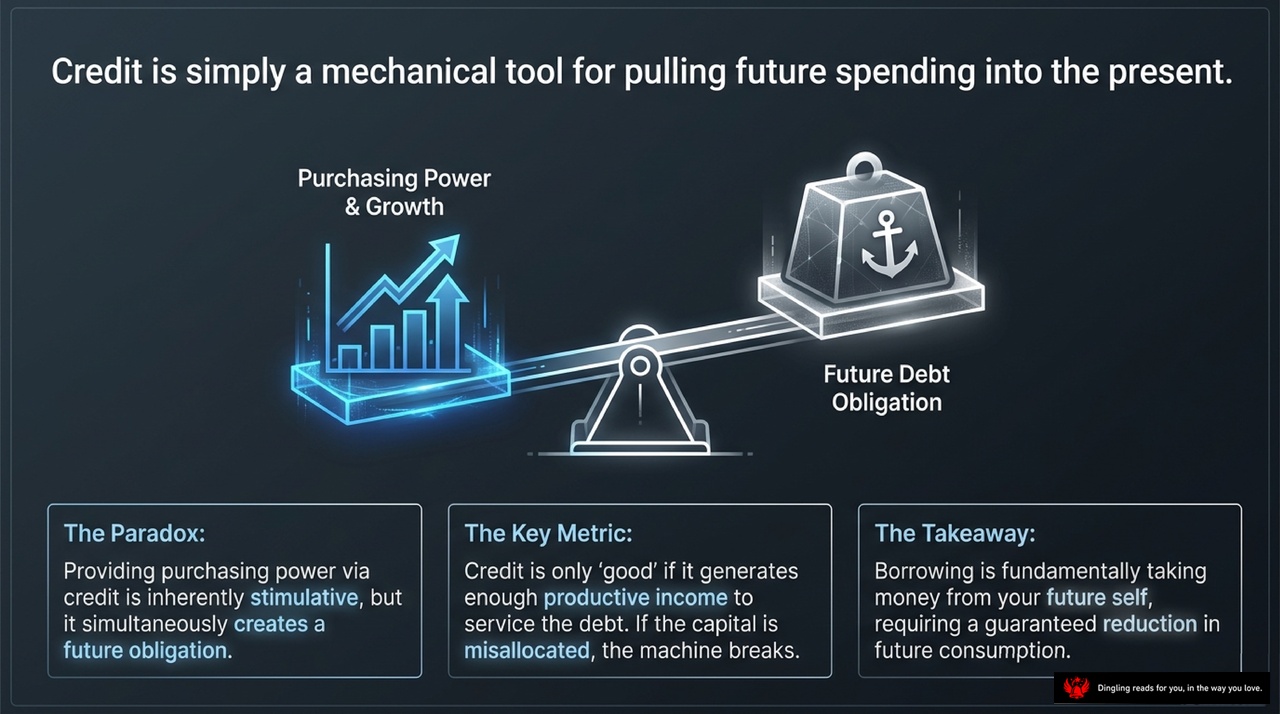
Credit is simply a mechanical tool for pulling future spending into the present. Think of it as a seesaw balancing two opposing forces: on one side, you gain immediate purchasing power and growth, but on the other, you carry the heavy weight of a future debt obligation. This is the fundamental paradox of borrowing.
When you use credit, you are essentially taking money from your future self. It's inherently stimulative, giving you the ability to buy today, but it simultaneously creates a binding contract to pay back tomorrow. The critical question isn't whether borrowing exists, but how you use it. If the capital is misallocated—if you borrow to consume rather than to generate productive income—the entire machine breaks. Credit is only "good" if it generates enough future earnings to service that debt.
Ultimately, borrowing requires a guaranteed reduction in your future consumption. If you don't create enough value to cover the interest and principal, the cycle of debt will tighten, eventually leading to a crisis where the weight on the right side of the seesaw crushes the growth on the left.

The global economy isn't a random roller coaster; it's a predictable, seven-stage mechanical cycle. Look at this chart. It starts with the **Early** phase, where credit expands and property becomes king. We convert cash into hard assets, driving up prices. But eventually, we hit the **Bubble** and reach the **Top**. That's when debt hits its limit, and the inevitable crash begins.
Once the bubble bursts, we enter **Depression**. This is where the rules change completely. In the first phase, **Property is King** because borrowing is cheap and profitable. But in the second phase, **Cash is King**. Why? Because debt servicing consumes all your income. To survive, you are forced into fire sales of assets, which generates scarce liquidity and crashes prices further.
The chart also highlights the transition from **Beautiful Deleveraging** to **Pushing on a String**, and finally, **Normalization**. This cycle repeats because of human nature: we love to borrow and spend, but we hate to pay back. When short-term cycles stack up, they create a long-term debt crisis. Recognizing these stages—like high asset prices and excessive leverage—allows us to anticipate the shift from expansion to contraction. Understanding this rhythm is the key to navigating economic turmoil.

Let's talk about the six specific diagnostic indicators that reveal the invisible formation of a debt bubble. Imagine you are looking at a radar chart, where each axis represents a critical signal that, when aligned, warns us that the market has reached its peak.
First, look at **Pricing**. This is the most obvious sign: asset prices become exceptionally high relative to historical standards. When houses, stocks, or bonds trade at levels that simply don't make sense based on past data, something is amiss.
Next, consider **Sentiment**. In a healthy market, opinions are mixed. But in a bubble, bullish sentiment becomes universal and unquestioned. Everyone agrees the price will go up forever, and no one dares to say otherwise. This collective confidence is often what pushes prices even higher.
Then there is **Leverage**. This is the fuel for the fire. We see broad and aggressive leverage being utilized to fund purchases. Investors aren't using their own cash; they are borrowing heavily, often using the assets themselves as collateral. This amplifies both gains and, eventually, losses.
As prices rise, **Behavior** changes. Buyers start making forward purchases, trying to protect themselves against future price hikes. They buy not because they need the asset, but because they are afraid of missing out on further gains. This creates a self-reinforcing cycle where buying drives prices up, which encourages more buying.
Who enters the market during this time? That's **Demographics**. A wave of new, inexperienced buyers enters the fray. These are often people who have never owned assets before, drawn in by the easy money and the fear of being left behind. Their lack of experience makes them particularly vulnerable when the tide turns.
Finally, we have **Policy**. Often, stimulative monetary policy inadvertently fuels further speculation. Central banks, focused on keeping unemployment low or growth steady, may lower interest rates or keep them low for too long. This cheap money acts like oxygen to the flame, allowing the bubble to grow larger and last longer than it otherwise would have.
When all six of these indicators point in the same direction, the bubble is fully formed. It looks like a golden age, but underneath, the foundation is fragile. Recognizing these signals early is the only way to prepare for the inevitable correction that follows.
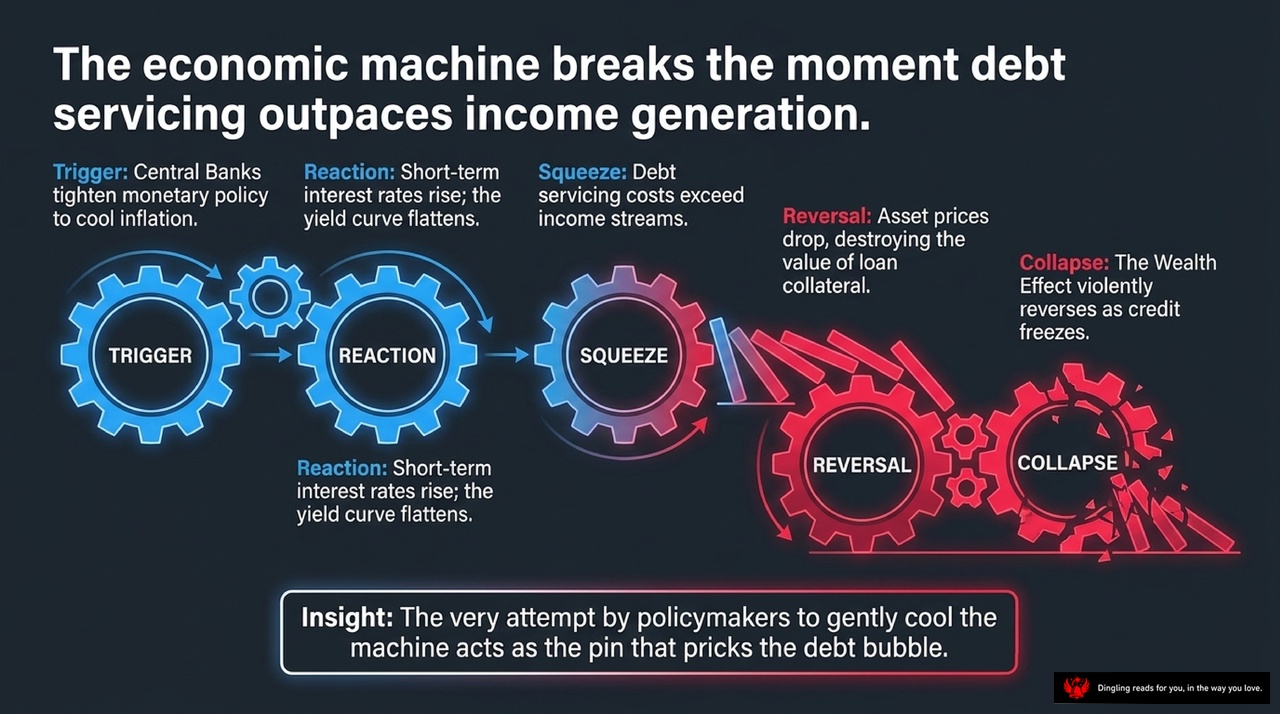
The economic machine breaks the moment debt servicing outpaces income generation. This isn't just a theoretical model; it's a historical replay we've seen in Germany, the US, and beyond. Look at the gears turning here: it all starts with a **Trigger**. Central banks tighten monetary policy to cool inflation, raising short-term rates. That's the **Reaction**: as rates rise and the yield curve flattens, borrowing costs spike. Suddenly, you hit the **Squeeze**. Debt servicing costs exceed income streams. Companies and households can't pay up, forcing them to sell assets or cut spending.
This triggers a violent **Reversal**. Asset prices drop, destroying the value of loan collateral. When collateral vanishes, credit freezes, and the **Collapse** follows: the Wealth Effect reverses violently as the entire system grinds to a halt.
The critical insight at the bottom is stark: the very attempt by policymakers to gently cool the machine acts as the pin that pricks the debt bubble. When interest rates rise to fight inflation, they inadvertently accelerate the deflationary spiral. As we saw in the 1929 crash and the 2008 crisis, trying to manage the machine often breaks it. The moment debt service costs outpace what the economy can generate, the gears jam, and the collapse becomes inevitable.
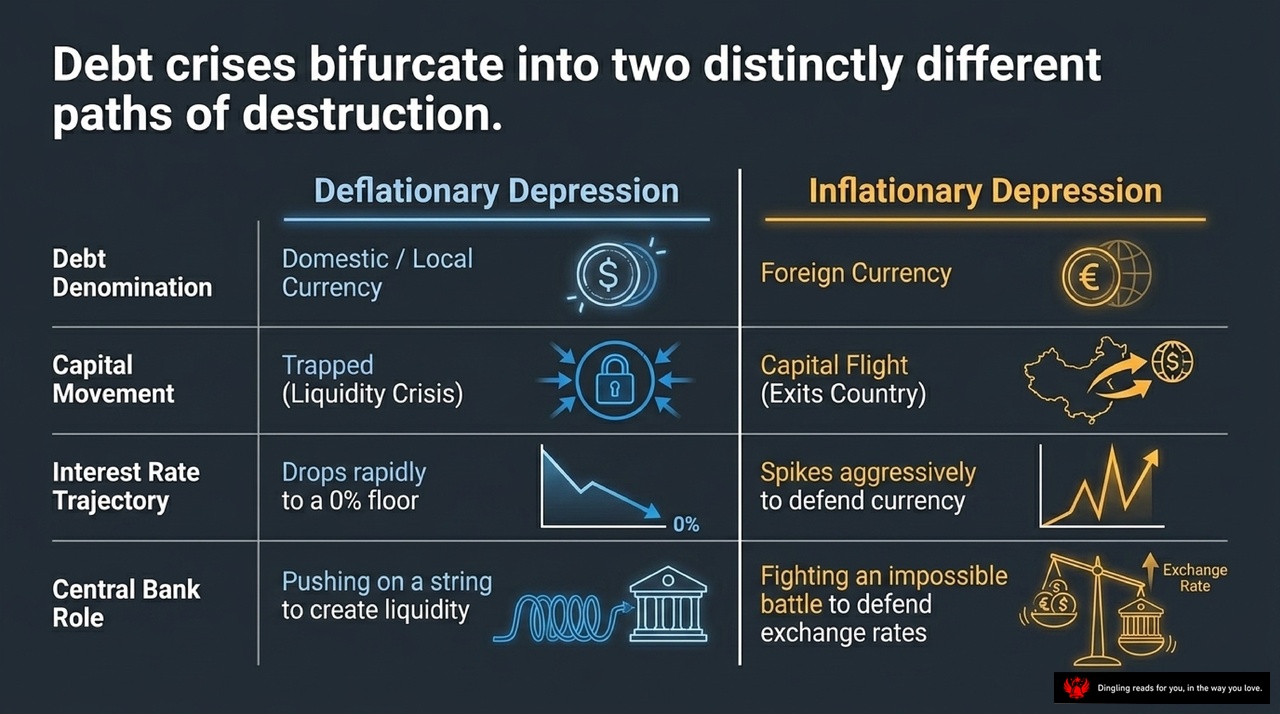
Debt crises don't follow a single path; they split into two very different routes of destruction. Look at this slide: on the left, we have Deflationary Depression, and on the right, Inflationary Depression. The key difference starts with the currency used for the debt. In a Deflationary scenario, the debt is denominated in domestic currency, like the dollar here. When capital gets trapped due to a liquidity crisis, interest rates crash rapidly to the zero floor, and the central bank's job becomes a desperate game of pushing on a string to create liquidity.
On the other side, we have Inflationary Depression. Here, the debt is denominated in foreign currency, like the euro. When a crisis hits, capital doesn't get trapped; instead, it flees the country. To defend the exchange rate, interest rates spike aggressively, and the central bank fights an impossible battle to keep the currency stable. Eventually, the balance of trade tips, and the currency collapses.
The text explains that Inflationary Depression is most dangerous for countries without reserve currencies that have borrowed heavily in foreign money. Unlike the domestic currency crisis where you can print money to solve problems, an external currency debt crisis is far more severe. The central bank tries to raise rates to stop capital flight, but this kills the economy. When that fails, they are forced to let the currency depreciate, which triggers massive inflation and makes repaying foreign debts much harder. This is the harder, more painful path that countries like Weimar Germany or Argentina often face when they lose confidence in their currency.
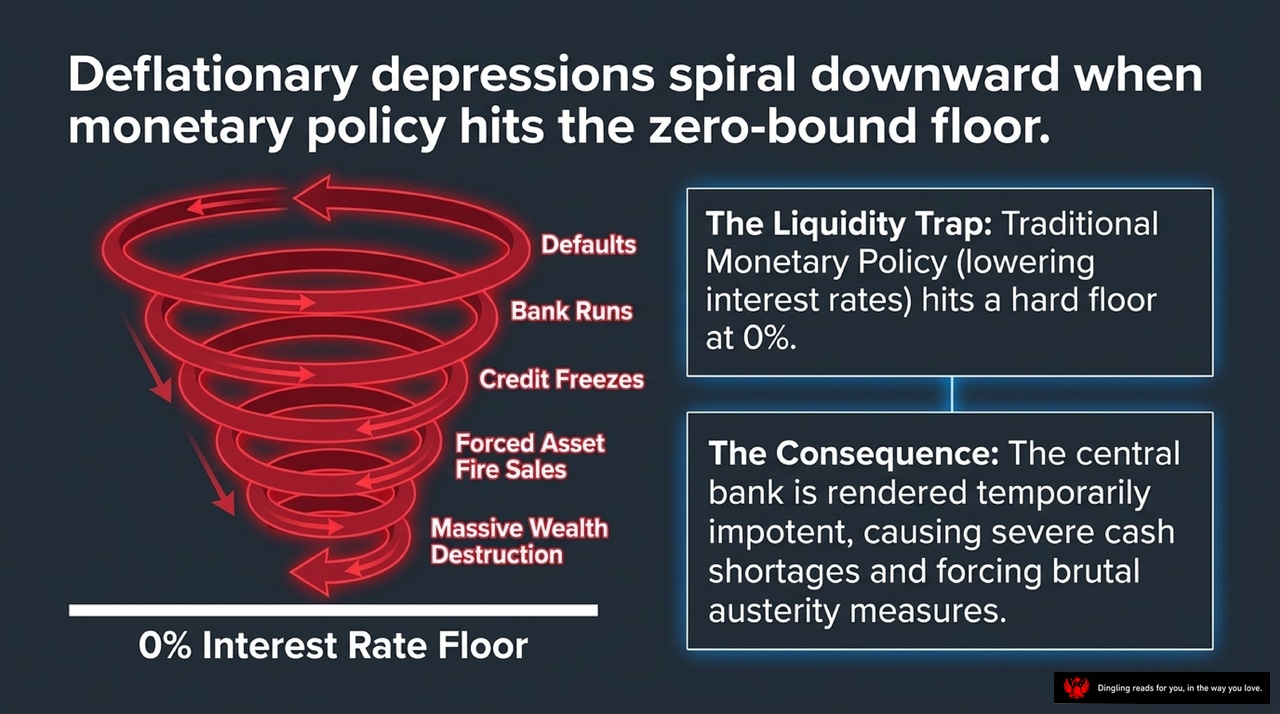
When traditional monetary policy hits a wall, the economy can spiral into a dangerous vortex known as a deflationary depression. As shown in this diagram, the trigger is often the "zero-bound floor"—the point where central banks cut interest rates to zero, but have nowhere left to go. This creates a "Liquidity Trap," rendering the central bank temporarily impotent and unable to stimulate growth through rate cuts alone.
Once trapped at this floor, the downward spiral accelerates. We see defaults, bank runs, and credit freezes take hold. As borrowing dries up, forced asset fire sales begin, leading to massive wealth destruction. The consequence is severe cash shortages, which forces governments to implement brutal austerity measures, deepening the crisis. This cycle highlights a critical reality: when debt is denominated in the local currency and rates hit zero, the standard tools fail, and the path to recovery becomes incredibly painful without decisive, unconventional action.

Think of the global economy as a complex machine that occasionally breaks down, requiring policymakers to pull specific levers to recalibrate it. As we've explored the historical cycles of debt—from the hyperinflation in Weimar Germany to the Great Depression and the 2008 financial crisis—we've identified a clear framework for how leaders respond when the system stalls.
The slide outlines these four distinct tools. On the left, representing deflationary pain, we see **Austerity** and **Debt Defaults**. Austerity involves cutting government spending to reduce the deficit, a painful but traditional response to a crisis. Alternatively, nations may face **Debt Defaults & Restructuring**, where they simply refuse or renegotiate their obligations, effectively writing off the debt to restore balance.
On the right, representing inflationary stimulus, the tools shift to **Wealth Redistribution** and **Debt Monetization**. Wealth Redistribution uses taxes and transfers to move money from one group to another, stabilizing demand without necessarily creating new money. The most powerful, yet controversial, lever is **Debt Monetization**, often called "money printing." This is when the central bank directly purchases government debt, effectively funding the deficit by creating new currency.
History shows that the choice between these levers defines the outcome. In the 1930s, the U.S. initially pulled the wrong lever with austerity, deepening the depression. Later, under Roosevelt, they switched to debt monetization and wealth redistribution, successfully transitioning from a painful deflationary spiral to a harmonious deleveraging. Understanding when to tighten the belt versus when to print money is the ultimate test of economic leadership.
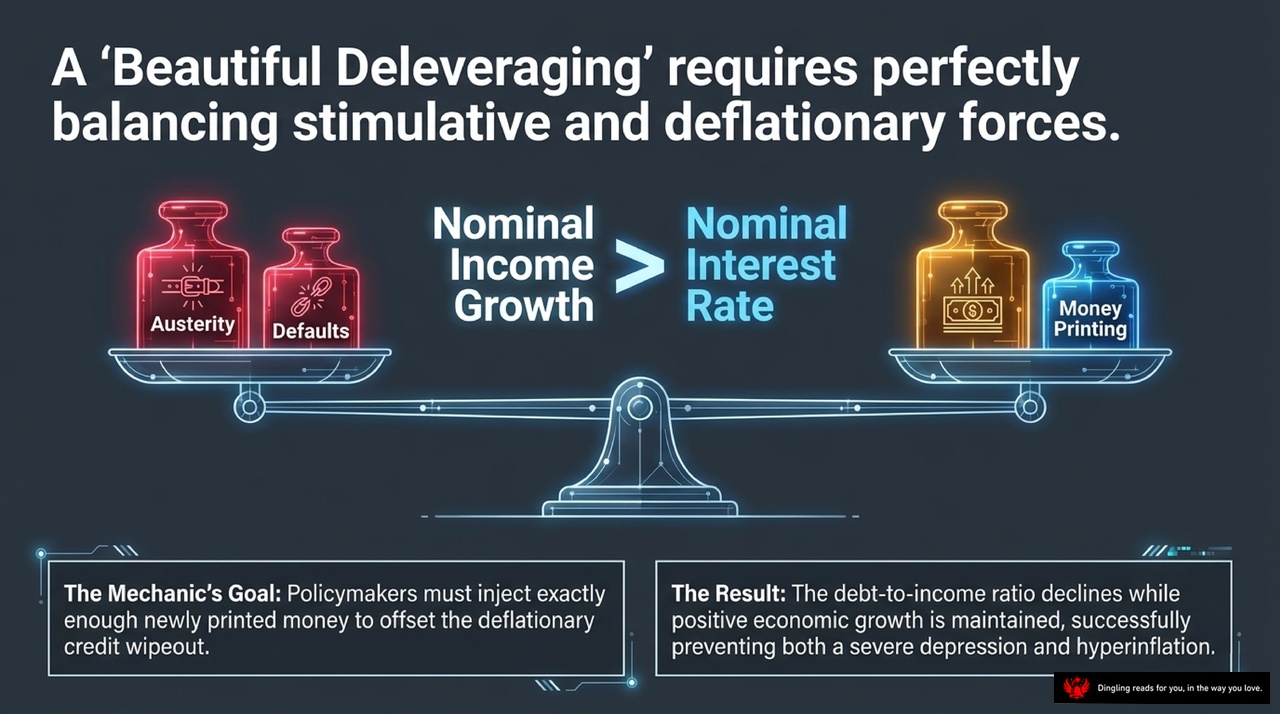
Imagine a seesaw balancing the economy's future. On one side, we have the painful but necessary forces of austerity and defaults, represented by those red bottles. On the other, the stimulative push of money printing and asset growth, shown in gold and blue. The core challenge for policymakers is finding that perfect equilibrium. As the slide illustrates, a "beautiful deleveraging" isn't about choosing one side over the other; it's about perfectly balancing stimulative and deflationary forces.
The mechanic's goal, as we see at the bottom, is precise: inject just enough newly printed money to offset the deflationary credit wipeout. This isn't about bailing out everyone; it's about managing the math so that nominal income growth exceeds the nominal interest rate. When this inequality holds true, the debt-to-income ratio naturally declines. This allows the economy to shed its heavy debt burden without triggering a severe depression or spiraling into hyperinflation.
Think of it as a delicate dance. If you cut spending too aggressively without enough income growth, you crush the economy. But if you print too much money without real growth, you invite inflation. The sweet spot—where the seesaw balances—is where positive economic growth is maintained while the debt load shrinks. It's the difference between a chaotic crash and a managed, "beautiful" recovery.

Central banks are no longer just tweaking interest rates; they are forced to escalate through a full three-tiered ladder of monetary policy because traditional tools are simply losing their grip. As the slide clearly outlines, the first line of defense is Tier 1: MP1, which relies on adjusting interest rates. This works beautifully until rates hit that hard floor of zero percent. Once we hit that limit, the playbook changes entirely.
We move to Tier 2: MP2, known as Quantitative Easing. This is where central banks start printing money to buy financial assets directly. While this drives up asset prices, it comes with a heavy cost: it disproportionately benefits the wealthy, widening the wealth gap while doing little to stimulate the average consumer. When even this fails to get people spending, we arrive at Tier 3: MP3, or "Helicopter Money." This is the ultimate escalation—pushing on a string—where central banks resort to direct fiscal transfers, handing cash straight to citizens to jumpstart the economy. This structured escalation from interest rates to asset buying, and finally to direct cash transfers, is the modern framework for managing a debt crisis when the old rules no longer apply.
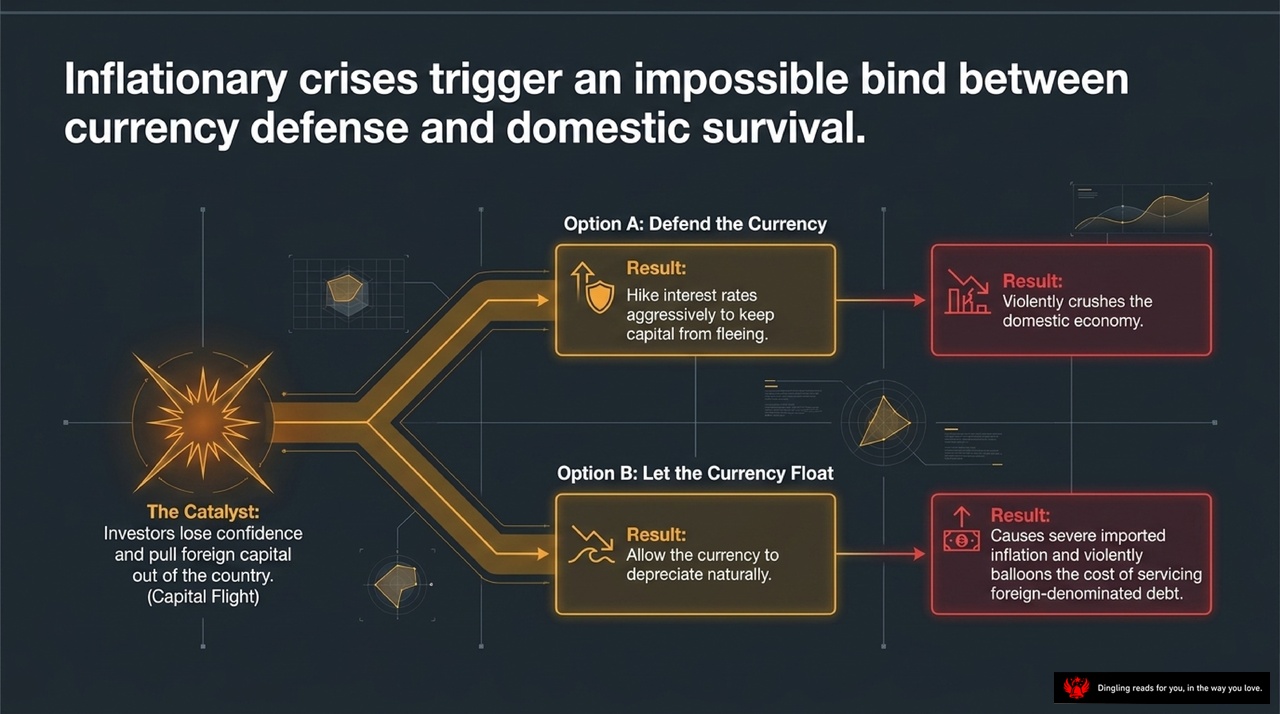
When investors lose confidence and pull their money out of a country, it triggers a terrifying "impossible bind" for policymakers. They are forced to choose between defending their currency or letting the nation survive.
Option A is to defend the currency. To stop capital from fleeing, the central bank must aggressively hike interest rates. While this keeps money in, it violently crushes the domestic economy, often leading to a deep recession.
Option B is to let the currency float. By allowing the currency to depreciate naturally, you avoid crushing the economy, but you pay a heavy price: severe imported inflation. As the currency loses value, the cost of servicing foreign-denominated debt balloons out of control.
As the slide illustrates, there is no perfect solution. You either starve your own economy to save the currency, or you let the currency fall and risk destroying your citizens' purchasing power. This is the brutal reality of inflationary crises.
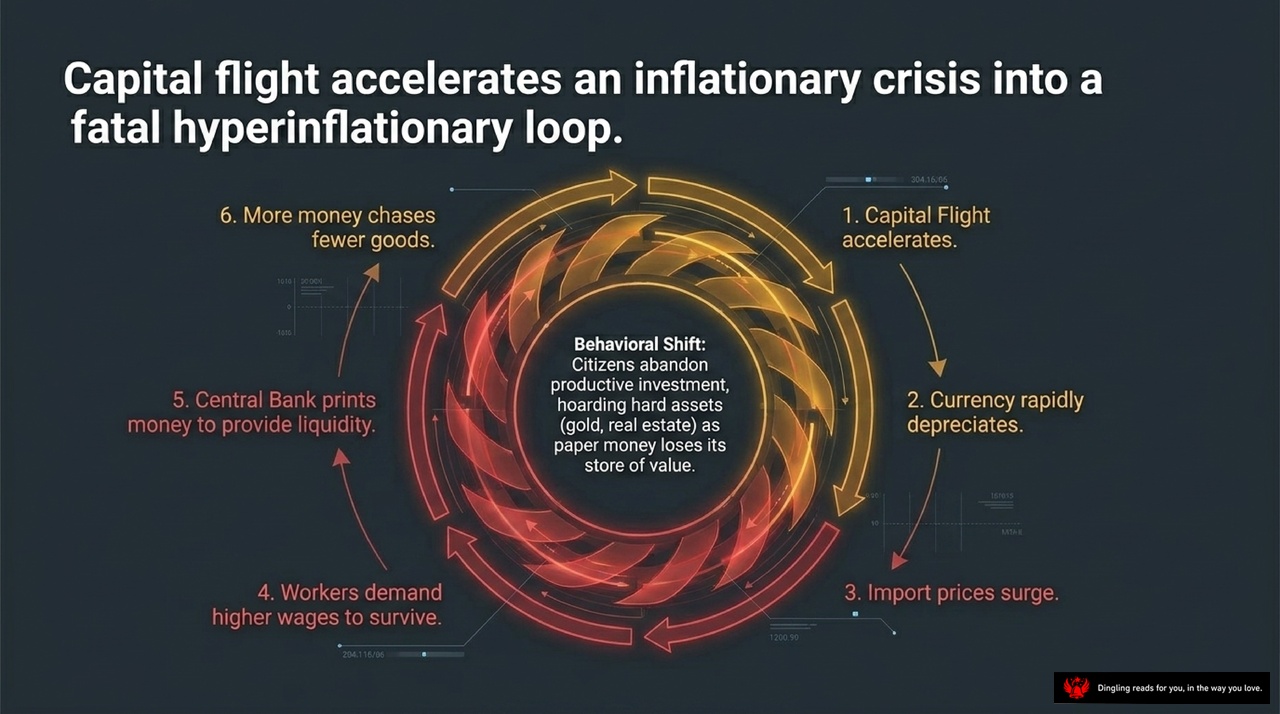
Capital flight acts as the spark that ignites a deadly chain reaction, turning a standard inflationary crisis into a hyperinflationary loop. As shown in this diagram, the process begins when capital flight accelerates, triggering a rapid depreciation of the currency. This loss of value immediately causes import prices to surge, forcing workers to demand higher wages just to survive. In response, the central bank prints more money to provide liquidity, which creates a scenario where more money chases fewer goods. This cycle fuels the initial panic, leading citizens to abandon productive investments and hoard hard assets like gold and real estate instead. This behavioral shift further accelerates capital flight, completing the fatal loop. The lesson is clear: when investors lose faith in paper money and flee en masse, the resulting currency collapse can spiral out of control, destroying the economy's foundation from the inside out.
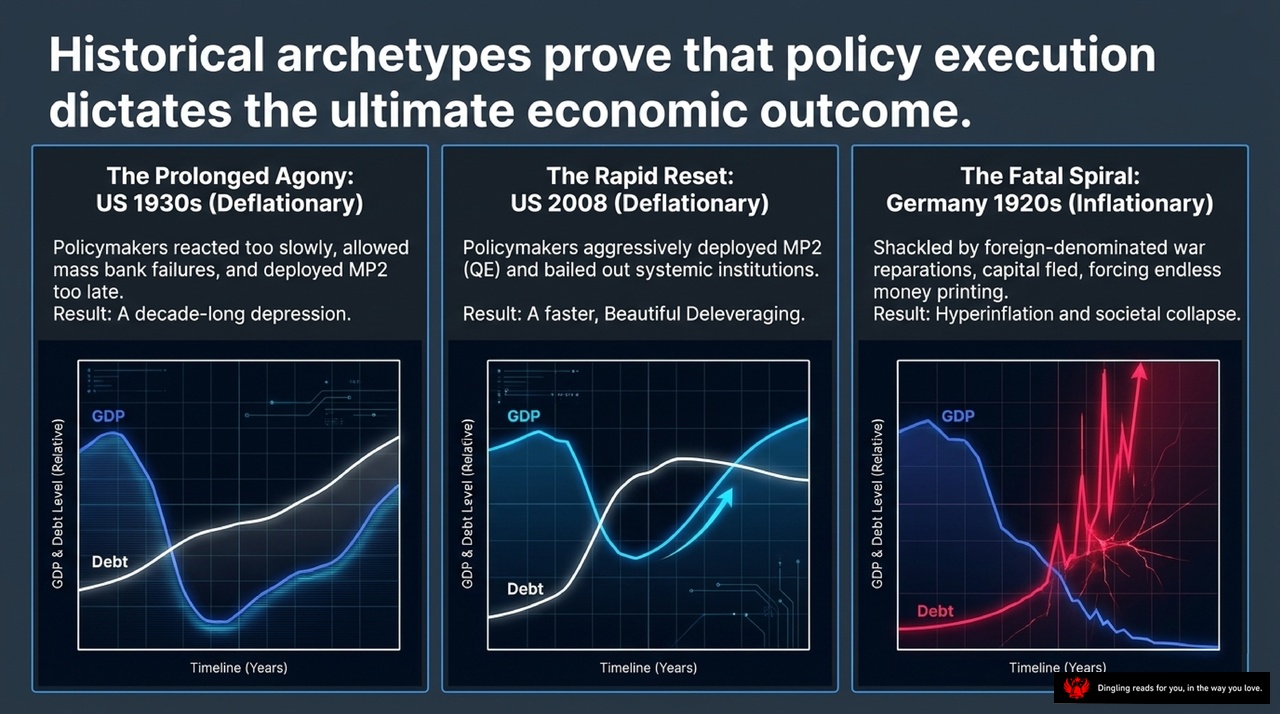
Historical archetypes prove that policy execution dictates the ultimate economic outcome. Look at the three paths we've traced: the prolonged agony of the US in the 1930s, the rapid reset of 2008, and the fatal spiral of Germany in the 1920s.
On the left, we see the Prolonged Agony. Policymakers reacted too slowly, allowed mass bank failures, and deployed monetary policy too late. The result was a decade-long depression where debt kept climbing even as GDP collapsed.
In the middle, we have the Rapid Reset from 2008. Here, policymakers aggressively deployed quantitative easing and bailed out systemic institutions. This allowed for a faster, beautiful deleveraging, turning a potential catastrophe into a manageable recovery.
On the right lies the Fatal Spiral, Germany in the 1920s. Shackled by foreign-denominated war reparations, capital fled, forcing endless money printing. The result was hyperinflation and societal collapse.
The graph below each scenario illustrates the core lesson: when you are forced to pay back debts in a foreign currency or when your own currency collapses under the weight of excessive printing, the outcome is not just economic pain, but total societal breakdown. Conversely, when you have the authority and tools to manage domestic debt, you can steer the ship through the storm. The difference between survival and collapse often comes down to one thing: the speed and decisiveness of your policy response.
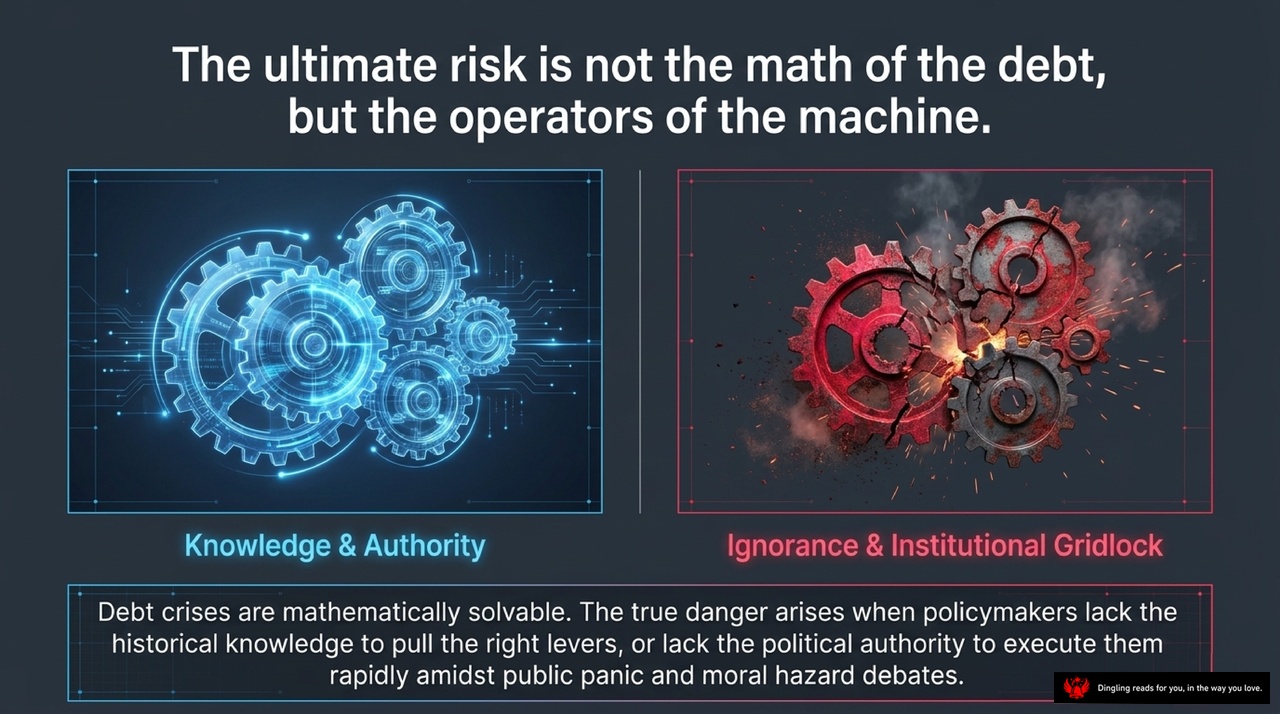
The ultimate risk in any debt crisis isn't the math itself, but the people running the machine. As this slide illustrates, the difference between survival and collapse often comes down to one thing: do you have knowledge and authority, or do you suffer from ignorance and institutional gridlock?
On the left, you see the ideal scenario. When policymakers possess deep historical knowledge, they know exactly which levers to pull to manage debt. They have the political authority to act quickly, even when public panic is rising or debates about moral hazards are heating up. In these cases, debt crises are mathematically solvable.
But look at the right side. This is where things go wrong. When operators lack that crucial historical context, they fail to pull the right levers at the right time. Worse, they often lack the political power to execute those solutions rapidly. This is the trap of institutional gridlock. Without the ability to act decisively, even a solvable debt problem can spiral into a catastrophic, unmanageable crisis. The danger isn't the numbers on the page; it's the failure of leadership to navigate them.

Debt cycles aren't some mysterious force of nature; they are logical, mechanical sequences driven by human nature, credit creation, and policy responses. The slide highlights a crucial distinction: whether a crisis ends in a devastating depression, hyperinflation, or a beautiful deleveraging depends entirely on the swift, balanced execution of monetary and fiscal levers.
As global debt reaches unprecedented heights, we face a pivotal question: do our current policymakers possess the historical blueprint to navigate the next turning of the cycle, or are we destined to repeat the catastrophic errors of the past? The answer lies not in luck, but in understanding how to balance these tools—whether through fiscal restraint, debt restructuring, or strategic money creation—to transform a painful contraction into a managed transition. History shows that the outcome is not predetermined; it is a choice made by those at the helm.