
Japanese Candlestick Charting Techniques: Complete Chapter-by-Chapter Summary

Welcome to our deep dive into *Japanese Candlestick Charting Techniques* by Steve Nison. Today, we're unlocking one of the most powerful tools in a trader's arsenal: the ability to read market psychology directly from the chart.
Before we get into the specifics, let's set the stage. For over a century, this ancient Eastern art remained hidden from the West. Nison's book was the definitive guide that finally translated these market signals into actionable trading strategies. Think of it as a revolution in technical analysis.
So, what exactly are we looking at here? These aren't just simple bars; they are stories of battle between buyers and sellers. Each candlestick tells us about the opening price, the high, the low, and the closing price for a specific period. The body of the candle represents the real battle—whether the close was higher than the open, showing bullish strength, or lower, indicating bearish pressure. The wicks, or shadows, reveal the extremes reached during that time, showing us where the market tried to go but was pushed back.
Why has this method become so popular globally? It's because it offers a unique advantage: it provides earlier signals of trend reversals compared to traditional line charts. Plus, the terminology is vivid and memorable, using names like "Hammer" or "Hanging Man" that instantly convey the market's emotional state.
Whether you are a beginner or a seasoned pro, mastering these techniques will help you identify entry and exit points with greater precision. In the chapters to come, we will break down these patterns, combine them with Western technical analysis, and learn how to use volume to confirm our signals.
Let's get started and learn how to read the market's true intent.
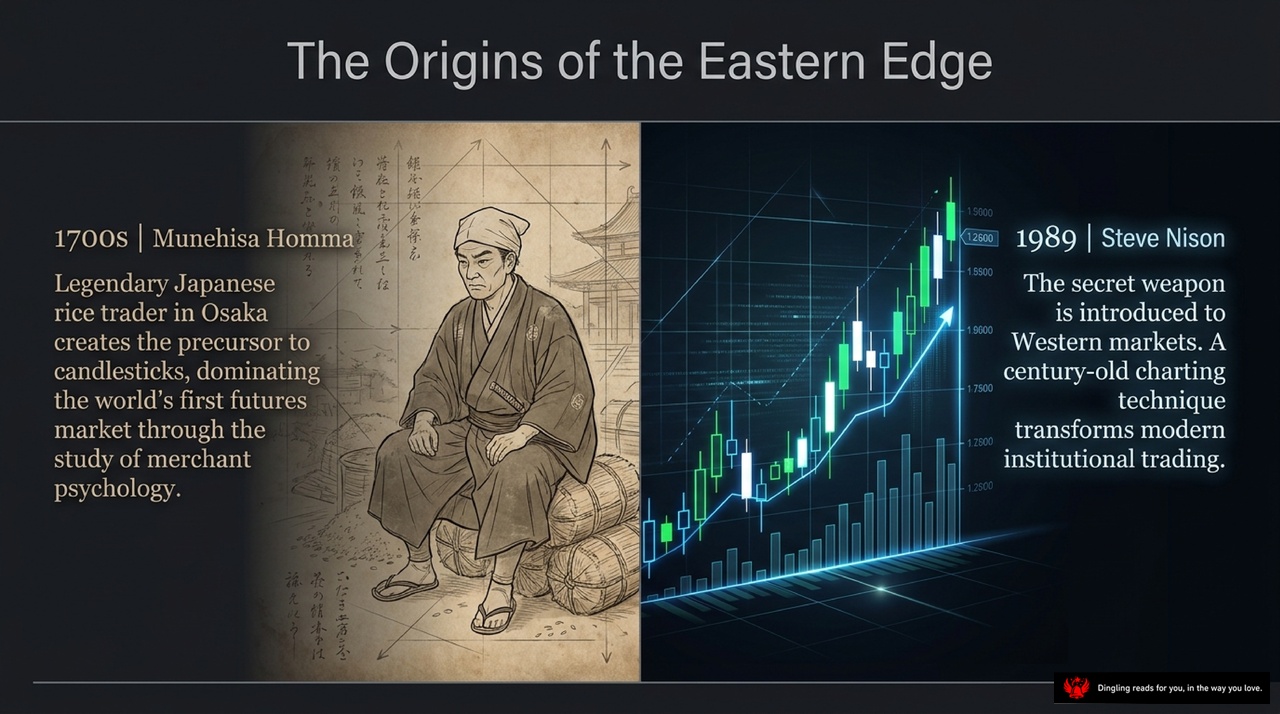
The Origins of the Eastern Edge isn't just a title; it's a story of how a centuries-old secret from Japan reshaped the way the world trades.
Let's look at the two giants on this slide. On the left, we have Munehisa Homma in the 1700s. He wasn't just a trader; he was a legendary rice merchant in Osaka who mastered the psychology of the market. He created the precursor to what we now call candlesticks, dominating the world's first futures market long before anyone else understood price action.
Fast forward to 1989, and we see Steve Nison. He took Homma's "secret weapon"—the candlestick charting technique—and introduced it to Western markets. This wasn't just about adding a new tool; it was a transformation of modern institutional trading. Today, those same green and red bars you see on the right side of this screen are the standard language for online traders and big institutions alike.
The lesson here is clear: the most powerful tools often come from the past. By understanding the psychology behind these charts, we gain an edge that transcends time.

On the left, you see the Western Bar chart—clean, linear, and focused strictly on math and logic. It tells you the numbers: the open, high, low, and close. But it's flat. It's a 2D snapshot that misses the story behind the price.
Now, look at the right side. This is the Eastern Candlestick chart. While it displays the exact same variables—Open, High, Low, and Close—it transforms those numbers into a 3D market. Suddenly, you're not just seeing data; you're witnessing a psychological power struggle between buyers, the bulls, and sellers, the bears.
The candlesticks bring emotion and psychology to the screen, revealing the Yin and Yang of every trading session. A long white body isn't just a number; it's a declaration of bullish dominance. A long black body screams of bearish pressure. And those thin wicks? They tell you exactly where the market fought back and gave ground.
This shift from a dry, mathematical bar to a dynamic, emotional candlestick is the first step in truly understanding what the market is feeling. It's no longer just about where the price went; it's about why it went there.

Look at the anatomy of a candle. This simple graphic breaks down the battle between buyers and sellers into three distinct parts. The top shadow, or upper wick, marks the absolute high of the day, showing where the market pushed up before getting rejected. The bottom shadow, or lower wick, indicates the absolute low, representing the support level where buyers stepped in. And right in the middle is the real body, the thick block between the open and close prices. This is the heart of the candle, representing the market's true substance and conviction.
Notice the color at the bottom: a white body means the close was higher than the open, signaling that bulls are in control. A black body means the open was higher than the close, showing that bears have taken charge. By reading these simple shapes, you instantly understand the intensity of the day's fight. A long body shows strong conviction, while a long shadow reveals that the market tested the extremes but was ultimately rejected. This visual language gives you an immediate edge, revealing the driving forces behind price movement before traditional charts can tell you.

In the world of technical analysis, trendlines serve as the vital bridge connecting Eastern candlestick wisdom with Western charting logic. They allow us to clearly map the battlefield between buyers and sellers.
When drawing a rising support line, we connect the lows of the candle wicks—specifically those bottom tips. You need at least two lower lows that are gradually rising. If you can cover three or more, that support line becomes significantly more reliable. This visualizes the buyer's aggression: every time the price dips, new buyers step in to absorb the selling pressure, pushing the lows higher.
Conversely, a falling support line connects these rising lows in reverse, linking progressively lower lows. This indicates a weaker market, but it still offers a potential zone for short-term rebounds. However, be careful; these rebounds are often limited and short-lived. You must look for confirmation, like a hammer or a bullish engulfing pattern appearing right at that line, to trust the bounce.
On the other side, we have resistance lines. A standard falling resistance line connects the highs of the candle wicks—those top tips. Just like support, you need at least two higher highs that are gradually dropping. The more points you connect, the stronger the resistance. This shows sellers actively pushing the price down. In a new high without prior reference points, you might draw an ascending resistance line by connecting higher highs to predict future pressure zones.
The real power lies in combining these trendlines with candlestick patterns. For instance, if a "pregnant line" appears right next to a falling resistance line, the pressure level is confirmed, and the price is likely to drop sharply. Even better, once a candlestick pattern signals a reversal, Western trendlines help us calculate the potential price target, something candlesticks alone can't do.
Finally, remember the concept of "False Breakouts." When price breaks below a support level but quickly rallies back up, it's a sign that sellers are exhausted. This is a classic opportunity to go long. The opposite happens with false breakouts above resistance: price spikes up but fails to hold, signaling a strong sell-off. By mastering these trendlines and integrating them with your candlestick signals, you transform vague price movements into clear, actionable trading paths.

Today's slide breaks down the core logic of reversals in candlestick trading. It challenges a common misconception: a reversal isn't necessarily a U-turn. Think of it as a trend change indicator, similar to a speeding car hitting its brakes. The car doesn't instantly reverse; it simply decelerates.
In our chart, you see that glowing line flattening out. This "reversal pattern" acts like a yellow traffic light. It signals that the time has come to protect your profits and adjust your risk, rather than blindly trading in the opposite direction.
The book emphasizes that we must distinguish between a true trend change and a simple pause. Just because the momentum slows down doesn't mean the trend is dead. However, when this deceleration happens at key levels—like support or resistance zones—it often sets the stage for a full trend shift.
So, when you spot this flattening line or a long upper wick, don't panic and short immediately. Instead, treat it as a warning sign. Lock in your gains, tighten your stops, and wait for confirmation before making your next move. This disciplined approach to managing risk is what separates successful traders from those who get caught off guard by sudden market turns.
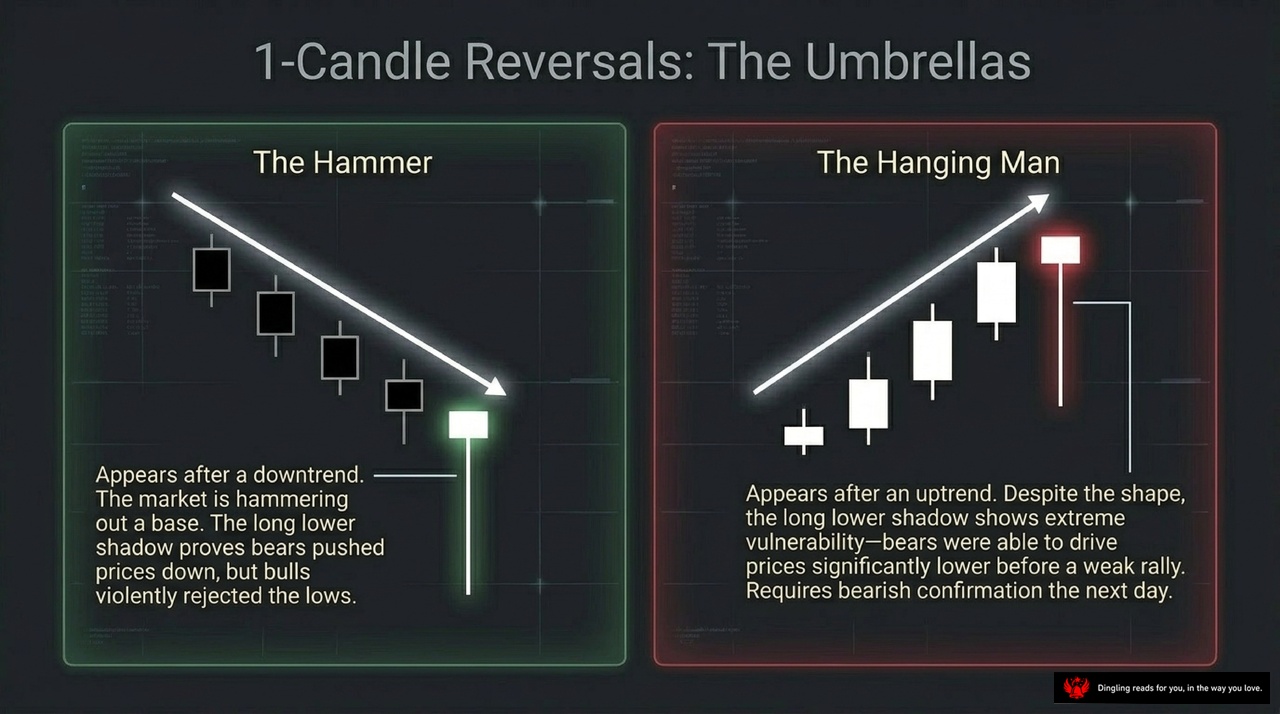
Today, we're diving into how to turn candlestick patterns from isolated signals into powerful, confirmed trading opportunities. As you can see on this slide, we're focusing on the concept of "Signal Convergence."
In real-world trading, relying on a single candlestick pattern—like a Hammer or an Engulfing pattern—is often risky. Why? Because a single signal can be misleading or a false alarm. The real magic happens when multiple different types of signals align in the same price zone. This is what we call signal convergence.
Think of it like a rope made of many strands. One strand might break easily, but when you bundle them together, the rope becomes incredibly strong. Similarly, when we see a Bullish Engulfing pattern, followed by a Hammer, and then a Piercing pattern, all appearing near the same support level, we aren't just seeing random shapes. We are seeing a collective agreement from the market that the trend is about to reverse.
Let's look at a practical example. Imagine a stock dropping to a key support level around 75 dollars. First, we see a massive Bullish Engulfing pattern, telling us buyers are stepping in. A few days later, the price dips again, and we see a Hammer, confirming that sellers are losing control. Then, we spot a Piercing pattern, pushing the price back up. Finally, a small upward gap appears.
When these four distinct signals—the Engulfing, Hammer, Piercing, and the Gap—all cluster together in the same area, the probability of a successful trade skyrockets. This convergence validates the support level, making it a high-probability entry point rather than a gamble.
The core principle here is simple: never trade on a single signal in isolation. Instead, build a "signal cluster." By combining candlestick formations with other technical concepts like gaps and specific price zones, you filter out the noise and catch the true turning points. This approach transforms candlestick analysis from a guessing game into a disciplined, high-confidence strategy.

Today's slide breaks down the two most powerful reversal patterns in candlestick analysis: the Engulfing Patterns. As you can see, we are looking at "Overwhelming Force" at work. The core rule is simple but critical: the second candle's real body must completely consume the first candle's body. This represents a sudden, complete transfer of power from one side to the other.
On the left, we have the Bullish Engulfing pattern. It appears after a downtrend. A small black candle is followed by a large white candle that swallows the previous one entirely. The upward arrow indicates that buyers have overwhelmed sellers, signaling a strong potential reversal to the upside. The larger this white candle is relative to the small black one, the stronger the signal.
On the right, you see the Bearish Engulfing pattern, which is the exact mirror image. It forms after an uptrend. A small white candle is followed by a large black candle that engulfs the first one completely. The downward arrow shows that sellers have taken total control, indicating a high probability of a trend reversal to the downside.
Remember, the size of the engulfing candle relative to the preceding candle is key. A massive engulfing candle confirms that the market sentiment has shifted dramatically. These patterns are among the most reliable reversal signals in technical analysis because they show a decisive battle where one side has clearly won.

Look at this slide on "2-Candle Reversals: The Deep Piercings." In trading, the market often tricks us by gapping in the direction of the trend, only to violently snap back. That's exactly what these two powerful patterns show. On the left, we have the Bullish Piercing Pattern. Imagine a strong black candle followed by a white one that gaps up. The magic happens here: the second candle's body must penetrate at least 50% into the first candle's body. If it does, it signals that buyers have overwhelmed the sellers, and a reversal is likely.
On the right, we see the mirror image: the Bearish Dark Cloud Cover. Here, the market gaps up, but the second black candle plunges down, cutting more than half of the first white candle's body. This indicates that selling pressure is crushing the buying momentum, signaling a potential drop.
The rule is simple but strict: if that second candle fails to cross the 50% threshold, it's not a reversal; it's just a stall. These "Deep Piercings" are your early warning system for when the trend is about to change direction.

Today's slide breaks down the most powerful reversal patterns in candlestick analysis: the "Stars." Specifically, we're looking at the Morning Star for bottoms and the Evening Star for tops. These aren't just random shapes; they represent a three-act drama of market psychology.
Act one is Conviction. You see a strong trend moving with force, like that long white candle on the left. The market is fully committed in one direction.
Then comes Act two: Stagnation. This is the critical pivot point. The trend stalls, and a small star forms. It's a gap away from the previous move, signaling that the battle has halted and energy is fading.
Finally, Act three is Reversal. The opposing force overwhelms the market. On the right, you see that long black candle crashing down, completing the pattern. The old trend is dead, and a new one is born.
The beauty of the Morning and Evening Star is that they give you a complete story. They don't just tell you a trend might change; they show you the exact moment the momentum shifts from one side to the other.

Today's slide focuses on a critical concept: the asymmetrical power of the Doji. Remember, a Doji is defined by having an identical open and close, signaling a complete gridlock in the market. But here's where it gets interesting—the location of this candle matters more than you might think.
Look at the Northern Doji at the top of the chart. This is highly dangerous. When an uptrend is in full swing and suddenly a Doji appears, it means the bullish momentum has instantly evaporated. The buyers are exhausted, and this often triggers an immediate reversal. It's a major warning sign that the trend is losing its steam.
Conversely, the Southern Doji at the bottom is less reliable on its own. In a falling market, prices can continue to drop under their own weight even when indecision is present. A Doji at the bottom doesn't guarantee a bounce; it just shows a pause. You must always wait for a bullish confirmation candle before assuming the trend has reversed.
The key takeaway is simple: a Doji at a peak is a red flag for trouble, while a Doji at a trough is just a moment of hesitation. Never trade a Doji in isolation; always look for the next candle to confirm your entry or exit.

In technical analysis, we often talk about "windows" or gaps in price action, and today we're looking at how these gaps transform into powerful support and resistance zones. As the slide illustrates, a gap doesn't just disappear; it becomes a structural landmark. Specifically, an upward gap, or a "Rising Window," that forms during an uptrend creates a solid support floor. Even when the market pulls back to correct, price tends to bounce off this gap rather than falling through it. Conversely, a "Falling Window" created by a gap down during a downtrend acts as a heavy resistance ceiling. When price attempts to rally back up, it often gets rejected right at that gap level. This concept is crucial because it shows how market psychology shifts: what was once an empty space becomes a battle line where buyers or sellers defend their positions. Whether you're trading day-to-day or looking at longer-term trends, understanding that these windows act as dynamic support and resistance levels can help you identify key turning points with greater confidence.

The power of candlesticks lies not just in their shape, but in how they layer with Western analysis to create a complete picture. As this slide illustrates, we are looking at a synthesis of two distinct analytical worlds. On the top layer, we have Eastern Candlesticks. This is about micro-level timing and psychology. It gives us early reversal warnings and reveals exactly what the market is feeling right now. Think of it as the emotional pulse of the trade.
Below that, we have Layer 2: Western Indicators. This is the macro view. It deals with price targets, structural context, and momentum. It tells us where the market is actually going. By using Eastern timing to enter trades against Western structural targets, you create an unparalleled analytical edge. You get the best of both: the sensitivity to catch a turn early, combined with the structural clarity to know where the trade should go. This fusion is the key to mastering the market.
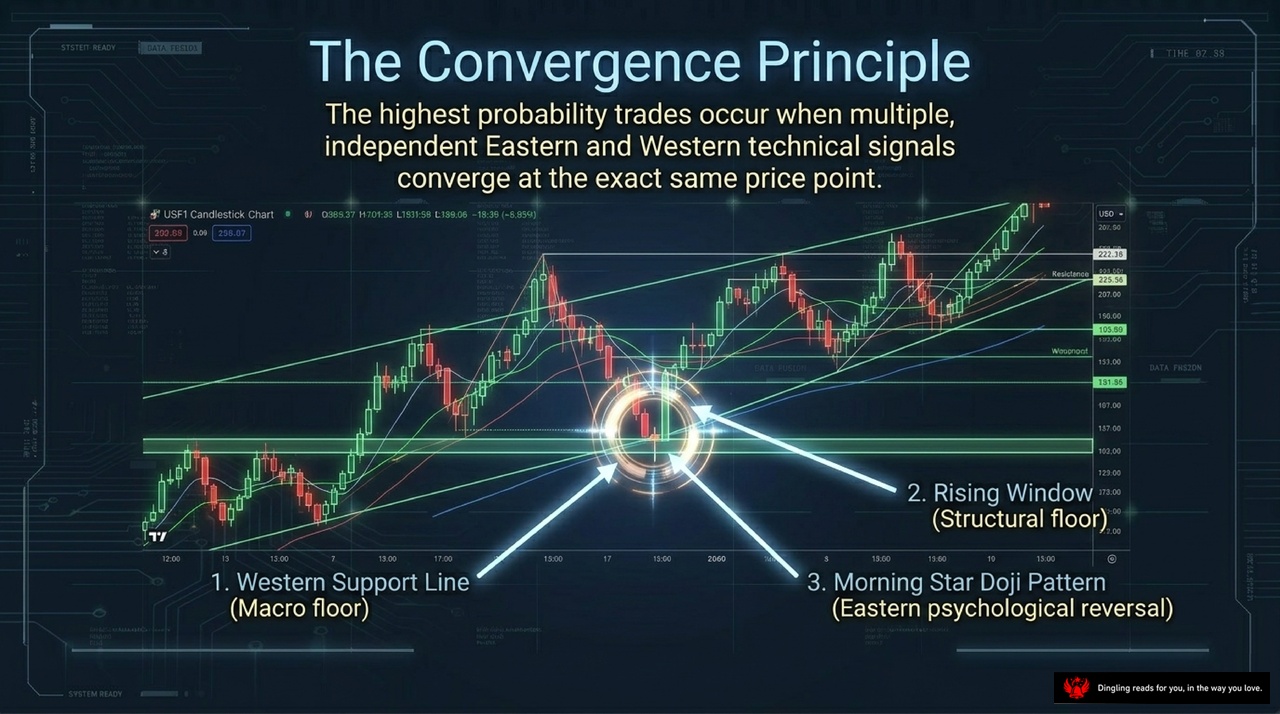
The Convergence Principle is all about timing—specifically, the perfect moment when multiple independent signals align at the exact same price point. Look at this chart: we're not just guessing; we're watching three distinct forces collide.
First, we have the Western Support Line, acting as our macro floor. This is the structural foundation, the hard floor built by Western technical analysis where buyers historically step in. But structure alone isn't enough.
Notice the Rising Window above it? That's our structural ceiling. It represents a zone where sellers have previously pushed prices down. When price approaches this window, we know resistance is loading up.
But here is where the Eastern magic happens. Right at that convergence zone, between the support and the window, we see the Morning Star Doji Pattern. This is a pure psychological reversal signal from Japanese candlestick theory. It tells us that after a long drop, the sellers are exhausted, and buyers are quietly taking control.
When the macro floor, the structural window, and the psychological reversal all hit the same spot, the probability of a successful trade skyrockets. This isn't just a random bounce; it's a high-probability setup where the market is screaming "turnaround" across every dimension. That is the true power of the Convergence Principle.

Candlesticks illuminate the hidden psychology of the market, transforming chaotic price data into a vivid battlefield of supply and demand. But how do we actually read this battlefield?
Think of every candle as a story of a single day's struggle. The body tells us who won—whether the bulls pushed the price up or the bears dragged it down—while the wicks reveal the rejection. Long wicks show us where traders were willing to go before being forced back, signaling strong resistance or support.
This isn't just about drawing lines; it's about decoding the emotional shift behind every price move. When you see a hammer or a shooting star, you're not just seeing a pattern; you're seeing a moment where the market's momentum changed, where fear met greed, and where the trend might be ready to reverse.
So, if the market is constantly speaking through these shifting shadows and solid bodies, are you finally ready to listen?