
Options, Futures, and Other Derivatives: Complete Chapter-by-Chapter Summary

Welcome to the world of financial derivatives. Think of this not just as a textbook, but as the definitive blueprint for the mathematical engines that drive global finance. In John C. Hull's classic work, *Options, Futures, and Other Derivatives*, we see the entire financial ecosystem visualized as a complex, interconnected machine.
Look at the intricate gears surrounding us. This isn't just abstract theory; it's a living system. The **Risk Transfer Module** at the heart of the diagram represents the core function of these instruments: moving risk from those who can't handle it to those who can. Whether it's an energy company hedging against oil price spikes or an investor protecting a portfolio, this module is always in motion.
Driving this engine are the **Derivative Nodes**. These are the specific contracts—futures, options, and swaps—that act as the levers of the market. They allow us to speculate, arbitrage, and, most importantly, manage uncertainty. Connected to these nodes are the **Option Valuation Engines**. These are the mathematical formulas, like Black-Scholes, that calculate the exact worth of a contract based on volatility, time, and interest rates. Without these engines, trading would be impossible.
The system also relies on a **Global Liquidity Pump**, ensuring that money flows freely to meet these obligations, and **Capital Flow Conduits** that channel funds where they are needed most. From the **Future Contract Gearbox** managing standardized trades to the complex networks of credit and interest rate swaps, every part is calibrated to control global financial gravity.
This book provides the manual for operating this machine. It takes you from the basics of how a simple future contract works to the advanced modeling of credit derivatives and real options. It equips you with the tools to understand not just the price of an asset, but the value of the risk itself. Whether you are a student, a trader, or a corporate treasurer, mastering these mechanisms is essential for navigating today's volatile markets. Let's dive into how this machine works.

Imagine the entire financial world built on a single, elegant principle: value isn't always intrinsic; sometimes, it's derived. Look at this diagram. On the left, we have the "Underlying Foundation"—tangible realities like a barrel of oil, a share of stock, or the fluctuating exchange rate between the pound and the dollar. These are the fundamental variables that drive the economy.
But on the right? That's where the magic happens. Through a process of "Derivation," these physical assets are transformed into a "Derivative Contract Specification." This contract itself holds no intrinsic value, no matter how complex its formulas or charts look. It is purely a mathematical extraction of the underlying asset's potential.
This is the core premise of our topic today: a derivative is a highly calibrated tool designed for one specific purpose—the isolation and transfer of exposure to uncertainty. Whether tied to the price of pork bellies, snowfall, or corporate stocks, the derivative strips away the asset itself and leaves behind a pure bet on its future movement. It allows you to separate the risk from the asset, letting you trade the uncertainty without touching the underlying commodity. This is the architecture of modern finance, turning raw volatility into a tradable instrument.

So, let's talk about the unsung heroes keeping the financial engine running smoothly. You see this triangle on the slide? It represents the three pillars of **Market Liquidity & Efficiency**.
First, we have the **Hedgers**, or "The Shield." Think of them as the protective barrier. Their job isn't to gamble; it's to neutralize risk. A classic example is an airline locking in jet fuel prices today to protect against future price spikes. They use contracts to stabilize their costs, acting as the shield for the business world.
Next, we have the **Speculators**, labeled here as "The Magnifying Glass." These are the risk-takers. They willingly absorb volatility in exchange for potential profit, often using the mathematical leverage that derivatives provide. Without them, the market would lack the necessary volume and price discovery that speculators bring to the table.
Finally, there are the **Arbitrageurs**, or "The Scale." These are the market's self-correcting mechanism. They execute simultaneous, offsetting trades across disconnected markets to lock in riskless profit. Their role is crucial because, by doing so, they force prices back into alignment, ensuring that no arbitrage opportunities linger for long.
Together, these three groups create a balanced ecosystem where risk is managed, liquidity flows, and prices remain efficient.

Welcome back. Today, we're diving deep into the mechanics of interest rates, the backbone of almost every financial instrument you'll encounter. Think of interest rates not just as a number on a screen, but as the heartbeat of the entire global economy.
In our previous lessons, we touched on the basics of derivatives. Now, let's zoom in on the pricing foundation. As you can see on your screen, we are looking at the core dimensions that drive value: the types of rates, how we measure them, and the models we use to price them.
First, let's talk about the "Nature of the Contract" and "Market Venue." In the world of rates, you aren't just dealing with one single number. You have the risk-free benchmark, like the Treasury yield, which is your anchor. Then you have LIBOR, the historic benchmark for interbank lending, and the Federal Funds Rate for overnight borrowing. Understanding the difference between these is crucial. For example, LIBOR is unsecured, while the Fed Funds rate is secured, which is why they don't always move in perfect lockstep.
Next, look at the "Risk Profile." How do we actually measure the cost of money over time? We use the concept of "Zero-Coupon Rates." Imagine you invest money today and get it all back at the end; that's a zero-coupon rate. By plotting these rates across different time periods, we create the Yield Curve. This curve tells us if the market expects rates to go up or down. If the curve is steep, it suggests long-term rates are higher than short-term ones, which usually signals economic growth.
Now, let's get to the "Primary Utility"—the math behind the magic. How do we price a bond or a future interest rate swap? We use Forward Rates. Think of a forward rate as a promise made today about what the interest rate will be tomorrow. If you know today's 1-year rate and tomorrow's 2-year rate, you can mathematically derive what the rate for the second year will be. This is the engine behind pricing almost everything from mortgages to corporate bonds.
Finally, consider the "Primary Utility" in a broader sense: Hedging and Speculation. Companies use these tools to lock in their borrowing costs. For instance, if a company knows it needs to borrow money in three months, they can buy a futures contract today to fix that rate, protecting themselves from a potential rate hike. Conversely, speculators might bet that rates will fall, trying to profit from the price movement.
So, to recap: we started with the different types of rates, moved to the Yield Curve as our map, used Forward Rates to bridge time gaps, and finally applied these concepts to manage real-world risk. Mastering this framework is the key to unlocking the rest of the derivatives world.
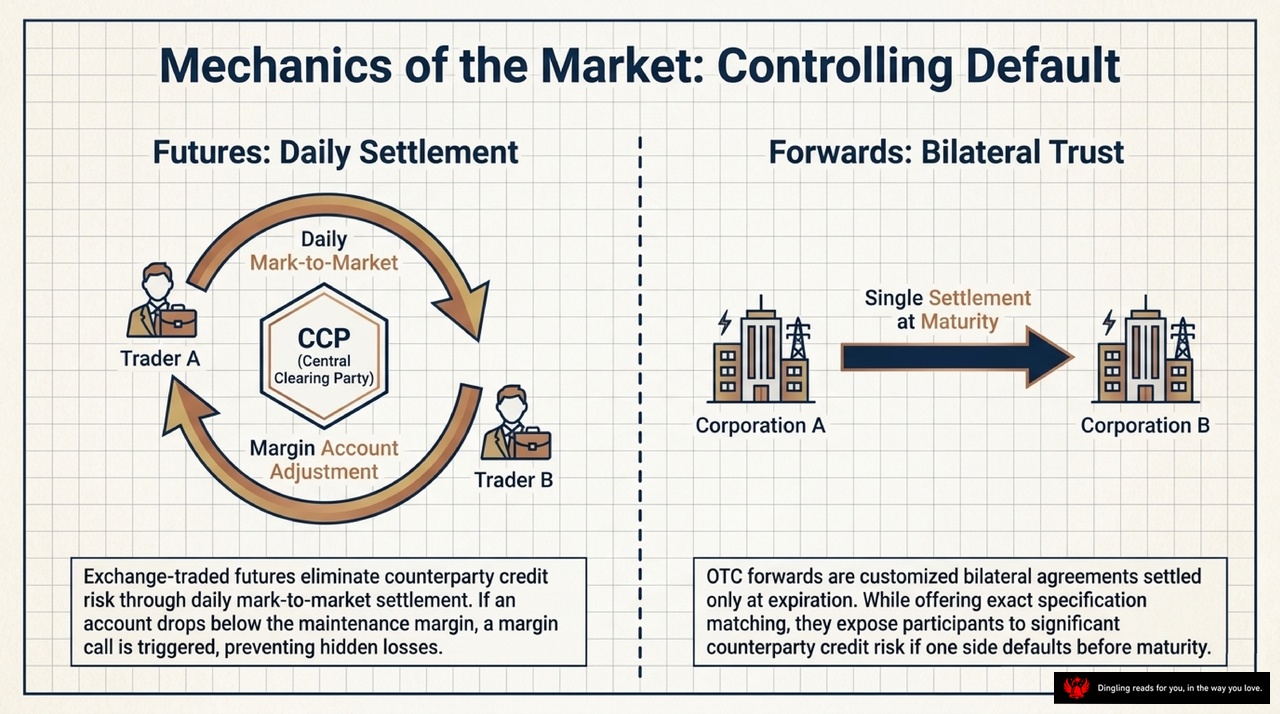
On this slide, we're drawing a sharp line between how futures and forwards actually handle risk. Look at the left side: Futures. This is the world of organized exchanges. The key here is the Central Clearing Party, or CCP. Notice the arrows circling around it—this represents daily mark-to-market settlement. Every single day, the exchange checks your account, adjusts your margin, and settles the profit or loss. If your money drops below the maintenance level, you get a margin call immediately. This mechanism completely eliminates counterparty credit risk. You don't have to worry about the other trader defaulting because the CCP stands in the middle, ensuring that hidden losses never accumulate.
Now, look at the right side: Forwards. This is the realm of Over-the-Counter, or OTC, trading. Here, there is no central intermediary. It's a bilateral trust between Corporation A and Corporation B. They rely on a single settlement only at maturity. While this allows for customized terms that fit your exact needs, it comes with a dangerous trade-off. If one side defaults before the final date, the other side is exposed to significant credit risk with no one to bail them out.
So, the fundamental difference is clear. Exchange-traded futures use daily settlement to lock in value and prevent systemic risk, whereas OTC forwards rely on the trust that your counterparty will honor their promise until the very end.

Imagine you're holding a ticket that gives you the right to buy or sell an asset at a specific price, but you're not forced to take the deal. That's the essence of an option. Unlike futures, where the obligation to perform is absolute, options separate the right to execute from the duty to act. This architectural difference creates a strictly asymmetrical payoff horizon for buyers and mathematically unbounded risk for writers.
Look at the charts on your screen. On the left, you see the buyer's perspective. Whether it's a long call or a long put, your risk is capped at the premium you paid, but your profit potential is theoretically unlimited. You control the downside while keeping the upside open.
On the right, the story flips for the writer. The writer's profit is capped at the premium received, but their risk is unbounded. If the market moves against them, losses can grow infinitely. This asymmetry is the core of options trading. It allows you to structure your exposure so that you benefit from volatility without exposing yourself to total ruin, or conversely, it offers a leveraged bet where you profit from a move while risking everything. Understanding this anatomy is the first step to mastering derivatives.

Welcome back to our deep dive into financial derivatives. Today, we're stepping into the heart of how we actually price these complex instruments, moving beyond abstract theory into a powerful, intuitive framework known as the **Binomial Tree**.
As you see on this slide, we are looking at "The Foundation of Pricing: Binomials." Before we jump into continuous-time calculus—which can get incredibly math-heavy—we start by mapping out discrete realities. Think of it like building a ladder for your asset's future price. We start at a current price, $S_0$, and then we ask a simple question: In the next time step, will the price go up to $S_u$ or down to $S_d$?
From there, the tree branches out. If we went up, do we go up again to $S_{uu}$, or do we come back down to $S_{ud}$? If we went down initially, do we recover to $S_{ud}$, or fall further to $S_{dd}$? This visual structure allows us to capture every possible outcome of an asset's journey over time.
But here is the profound secret that the binomial model reveals about derivatives pricing: **you do not need to know the market's true directional bias.** Whether the stock is likely to crash or skyrocket, it doesn't matter for the option's price. Instead, we construct a "risk-neutral" world. In this hypothetical world, we assume the asset grows at the risk-free rate, and we calculate the expected future payoffs—those values at the top of our tree like $S_{uu}$ or $S_{dd}$—and simply discount them back to today using that same risk-free rate.
This approach is revolutionary because it decouples the option's value from our subjective guesses about the economy. By focusing on these discrete probabilities and building a risk-free portfolio, we derive a precise, arbitrage-free price. It's a beautiful bridge between simple logic and complex finance, showing us that even in uncertain markets, there is a clear path to value.

Welcome to the final chapter of our deep dive into financial derivatives. Today, we're shifting gears from the complex world of interest rate and credit models to the tangible forces that drive global energy markets and the innovative ways we value real-world projects.
First, let's look at energy derivatives. These are specialized tools designed to manage the volatile pricing of commodities like crude oil, natural gas, and electricity. While crude oil futures are the most traded, dealing with natural gas and power adds layers of complexity due to storage constraints and the need for real-time supply-demand balance. We also see a surge in climate derivatives—innovations that allow companies to hedge against weather risks. For instance, a heating company might buy a "Heating Degree Day" call option to protect itself if a cold winter drives up energy costs, while a utility firm might use cooling degree day products to manage summer demand spikes. Even extreme events like hurricanes can be transferred to investors through catastrophe bonds, providing insurers with crucial capital when disasters strike.
Unlike traditional financial assets, commodities are driven by physical supply and demand, making their price swings much more dramatic. They also carry unique risks like inventory management and regulatory changes. This is where the concept of "Real Options" becomes game-changing. Traditional Net Present Value analysis often fails to capture the true value of flexibility. Real options allow us to treat business decisions—like expanding a factory, delaying a project, or switching production methods—as options themselves. By pricing these strategic flexibilities, companies can identify value that standard accounting methods miss, turning seemingly unprofitable projects into viable opportunities.
Finally, we must talk about the dark side of this industry: risk management failures. History is littered with cautionary tales, from the collapse of Barings Bank due to one trader's unauthorized positions to the massive losses at Orange County and Kidder Peabody. These disasters weren't just about bad luck; they were often the result of broken internal controls, over-reliance on flawed models, and a culture that confused hedging with speculation. The lesson is clear: no matter how sophisticated your pricing model is, robust governance, strict risk limits, and a clear separation of duties are the only true defenses against catastrophe.
As we wrap up, remember that derivatives are powerful tools, but they require discipline, understanding, and a healthy respect for the risks they introduce. Thank you for joining us on this journey through the world of options, futures, and the ever-evolving landscape of financial innovation.

Navigating Risk: The Greeks. In the volatile world of options trading, prices aren't static; they shift constantly based on a dozen different variables. To manage this complexity, traders don't just look at the current price—they measure the sensitivity of that price to change using a set of tools known as "The Greeks." Think of them as the dashboard gauges for your portfolio, each telling you a different story about risk.
First, we have Delta, represented by the symbol $\Delta$. This is your velocity gauge. It measures how much your option's price moves for every $1 change in the underlying asset. A positive Delta means you profit as the market rises; a negative Delta means you profit as it falls.
Next is Gamma, the symbol $\Gamma$. If Delta is speed, Gamma is acceleration. It measures how fast your Delta itself is changing. High Gamma means your hedge needs frequent adjustment because your exposure is shifting rapidly.
Then there's Theta, the symbol $\Theta$, which we call Time Decay. This is the silent erosion of your option's value as expiration approaches. It's a constant drain on your capital, reminding you that time is working against you.
We also track Vega, or Volatility Sensitivity ($\nu$). This tells you how exposed your position is to market panic or complacency. If volatility spikes, your options become more valuable; if the market calms down, they lose value.
Finally, we have Rho ($\rho$), Interest Rate Sensitivity. This measures how your portfolio reacts to macroeconomic shifts and central bank decisions. By monitoring these five dimensions—Price Velocity, Acceleration, Time Decay, Volatility, and Rates—you move from guessing to navigating, transforming dynamic risk into a manageable strategy.

Imagine the market not as a perfectly smooth, predictable curve, but as a rollercoaster where we are terrified of the sudden drop. This slide captures that very reality through the concept of the "Volatility Smile."
You see here the classic BSM assumption—a flat, dashed line suggesting that market risk is symmetric and predictable. But look at the brown curve labeled "Real-World Market Data." It tells a different story. This is the Volatility Smile. Notice how implied volatility spikes dramatically on the left side? That represents the massive premium traders pay for "left-tail catastrophe risk."
Why? Because of what the text calls "Crashophobia." Following the 1987 crash, the market permanently rejected the idea of perfect mathematical symmetry. Traders realized that markets don't just drift; they can crash much faster and harder than models predict. That is why you see such high volatility for deep out-of-the-money put options. Investors are demanding a massive premium just to feel safe against those rare, devastating tail events. In short, while math models assume a calm, symmetrical world, the real market is defined by our deep, irrational fear of the unexpected crash.

When standard vanilla options just don't cut it for your specific risk profile, the Over-the-Counter market steps in with "Exotic Options." These aren't just fancy names; they are custom-built financial instruments designed to match precise, non-standard payoff rules. Think of them as the bespoke suits of the derivatives world, tailored to fit risks that off-the-rack options can't cover.
First, look at **Barrier Options**. As the slide illustrates, these are all about hitting a specific price threshold. If the underlying asset touches that pre-determined line, the option either instantly activates—a "knock-in"—or vanishes completely in a "knock-out." It's a binary trigger based on a boundary condition.
Next, we have **Asian Options**. Unlike standard options that care only about the price on the final day, Asian Options look at the average price over the entire life of the contract. This structure is a brilliant hedge against market manipulation on the exact expiration date, as it smooths out short-term volatility spikes.
Then there are **Binary Options**, depicted here as a simple switch flipping from zero to one. These offer discontinuous payoffs: you get a fixed, predetermined cash payout if a specific condition is met, and exactly zero if it isn't. It's a pure bet on whether an event happens, with no intermediate values.
Finally, **Lookback Options** give you the ultimate advantage of hindsight. They allow the holder to execute the trade at the optimal high or low price achieved during the option's entire life. Essentially, you get to pick the best moment in the past to enter the market, eliminating the risk of timing your entry wrong.

Let's dive into the mechanics of credit risk and how securitization tries to tame it. Picture this: a subprime mortgage pool pouring into a series of buckets, creating a "waterfall" structure. This is the core idea behind Asset-Backed Securities and Collateralized Debt Obligations. The goal? To transform illiquid, risky debt into tradable derivatives by splitting the cash flows into different tranches.
As the diagram shows, the cash flows from the underlying mortgages fill these tranches from the top down. The Senior Tranche, rated AAA, sits at the top, theoretically insulated from all but catastrophic defaults. Below it sits the Mezzanine Tranche, rated BBB, and at the very bottom is the Equity Tranche, which is unrated. Here lies the trap. While investors believed this engineering was flawless, the reality is starkly different. Default losses don't hit the top; they hit the bottom-up first. The Equity tranche absorbs the initial shocks, followed by the Mezzanine, and only when the losses are massive enough to wipe out the lower layers does the Senior tranche get touched.
This "bottom-up" destruction mechanism is exactly what went wrong during the 2007 credit crisis. Investors incorrectly assumed the AAA-rated senior tranches were perfectly safe, ignoring the fact that the entire structure was vulnerable once the losses breached the equity and mezzanine layers. When the housing market collapsed, the losses cascaded up this waterfall, destroying the value of even the supposedly safest assets and triggering the global financial meltdown. Understanding this waterfall mechanism is crucial for grasping how credit risk is structured—and how easily that structure can fail.

When we talk about the 2007 Credit Crisis, we aren't just looking at a single event; we are looking at a total structural collapse. Imagine a building where the foundation is rotten, no matter how fancy the architecture above it gets, the whole thing eventually falls. That is exactly what happened.
The slide illustrates this perfectly. It starts with **Poor Underwriting Standards** and a **Simultaneous Housing Price Drop**. These were the cracks in the foundation. Lenders were giving mortgages to anyone, regardless of ability to pay, and when the bubble burst, housing prices crashed everywhere at once.
This triggered a critical failure point labeled **Disastrously High Default Correlation**. In the past, models assumed defaults would happen randomly and independently. But when prices fell simultaneously across the entire country, defaults happened together, not one by one. This shattered the mathematical assumptions behind the products.
The result was a **Systemic Tranche Collapse**. Even the "Senior AAA tranches"—the safest, top-tier parts of these complex securities—suffered catastrophic losses. The slide makes a powerful point: "Complex financial engineering cannot neutralize fundamentally toxic inputs." No amount of math or structural complexity can save a system built on a flawed foundation. When the underlying assets, like mortgages, are compromised, the entire derivative superstructure collapses with them.
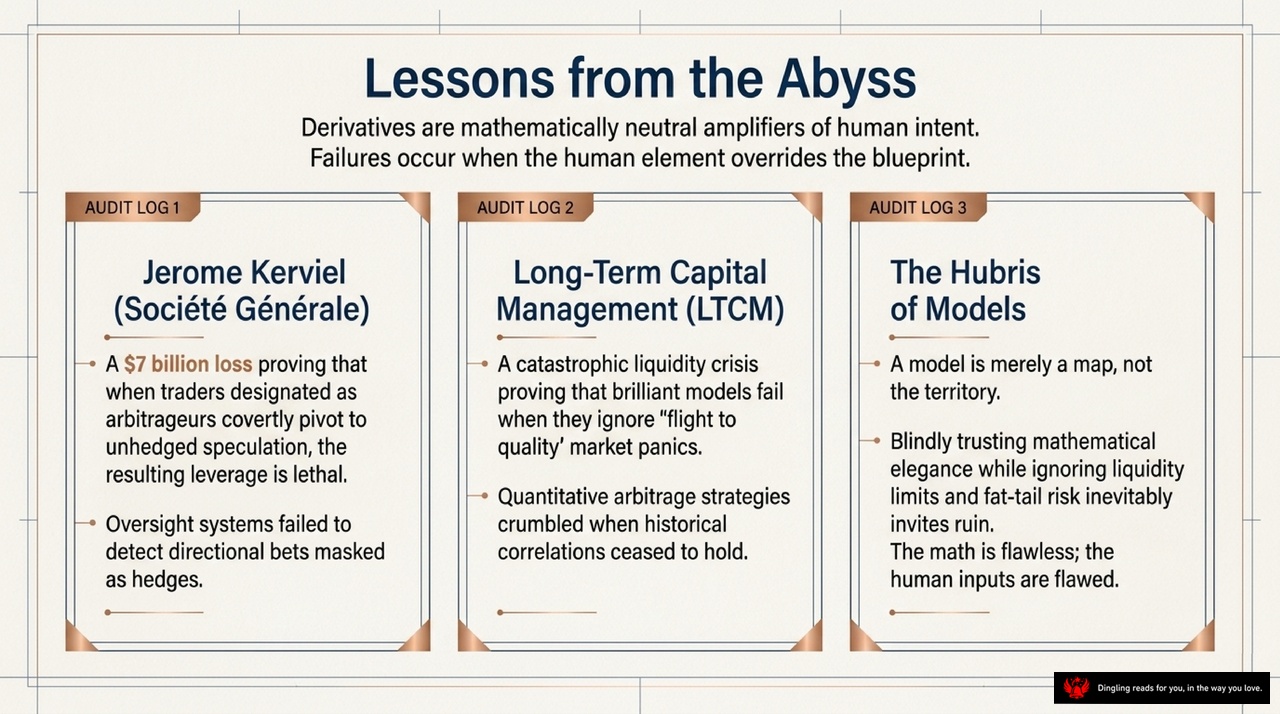
Look at this slide, "Lessons from the Abyss." It cuts straight to the heart of what went wrong in the biggest financial disasters of the last few decades. The core message is simple but terrifying: derivatives themselves are just mathematically neutral tools. They are amplifiers of human intent. They don't create risk; they magnify it. When the human element overrides the blueprint, the system collapses.
Let's look at the first audit log: Jerome Kerviel at Société Générale. He wasn't just making a mistake; he was a $7 billion loss in the making. The lesson here is about identity and oversight. When traders designated as "arbitrageurs" secretly pivot to unhedged speculation, the leverage they use becomes lethal. The oversight systems failed because they were looking for the wrong thing—they couldn't detect directional bets disguised as hedges.
Next, we have Long-Term Capital Management, or LTCM. This is the classic case of brilliant models failing when they ignore reality. LTCM faced a catastrophic liquidity crisis. Their quantitative strategies crumbled not because the math was wrong, but because they ignored the "flight to quality" panic. When correlations broke down, their models, which relied on historical data, simply didn't work anymore.
Finally, we have the hubris of models. The slide reminds us that a model is merely a map, not the territory. Blindly trusting mathematical elegance while ignoring liquidity limits and fat-tail risk inevitably invites ruin. The math can be flawless, but if the human inputs—the assumptions, the risk tolerance, the discipline—are flawed, the result is total destruction. These aren't just historical footnotes; they are warnings for anyone who thinks they can outsmart the market with a formula.

Imagine a balance scale, perfectly poised between two worlds. On one side sits a solid, tangible cube: **Physical Reality**, representing the underlying asset. On the other, floating in an ethereal geometric lattice, is **Abstract Mathematics**, symbolizing the derivative. This visual perfectly captures the essence of financial engineering: our ambitious attempt to engineer certainty out of an inherently chaotic world.
From ancient agricultural forwards to complex collateralized debt obligations, derivatives are the ultimate instruments of leverage. They can immunize global corporations against disaster or unravel the global economy when constructed on illusions. The critical question here isn't just about the math; it's about the human element. If derivatives merely amplify the intent and assumptions of their architects, are our future crises born from failures of financial engineering, or failures of human nature?
This slide sets the stage for our journey through the mechanics of these powerful tools. We will move from understanding the basic building blocks of futures and options to mastering the sophisticated models that price risk. But as we dive into the formulas and strategies, remember this: the math provides the framework, but human judgment drives the outcome. Whether you are a student building your foundational knowledge or a practitioner navigating volatile markets, understanding this balance between the physical asset and its abstract derivative is the key to mastering modern finance.