
Principles of Economics: Complete Chapter-by-Chapter Summary

Welcome to our deep dive into N. Gregory Mankiw's *Principles of Economics*. Set against the backdrop of our interconnected global map, this book serves as your essential guide to understanding how the world really works. It breaks down the complex machinery of our economy into three clear pillars: how individuals make decisions, how markets coordinate our interactions, and how the overall economy functions.
At its heart, economics is about managing scarcity. Mankiw introduces ten core principles to help us navigate this. First, individuals make decisions. We constantly face trade-offs, whether it's a student balancing study with work, or a society weighing national defense against environmental protection. Every choice has an opportunity cost—the value of what you give up to get something else. Rational people also think at the margin, adjusting their behavior in small increments rather than making all-or-nothing choices. Finally, people respond to incentives; when costs or benefits change, so do our actions.
Next, we look at how people interact. Trade is a powerful tool that makes everyone better off by allowing us to specialize and share. Markets, often guided by what Adam Smith called the "invisible hand," are usually the best way to organize economic activity. However, the government sometimes needs to step in to correct market failures, like pollution or monopolies, to ensure efficiency and fairness.
Finally, consider how the entire economy runs. A nation's standard of living depends on its ability to produce goods and services. When governments print too much money, inflation rises. And in the short run, there's often a trade-off between inflation and unemployment. Understanding these dynamics, from the circular flow of resources and money to the production possibilities boundary, gives us a clear picture of the economic forces shaping our lives.
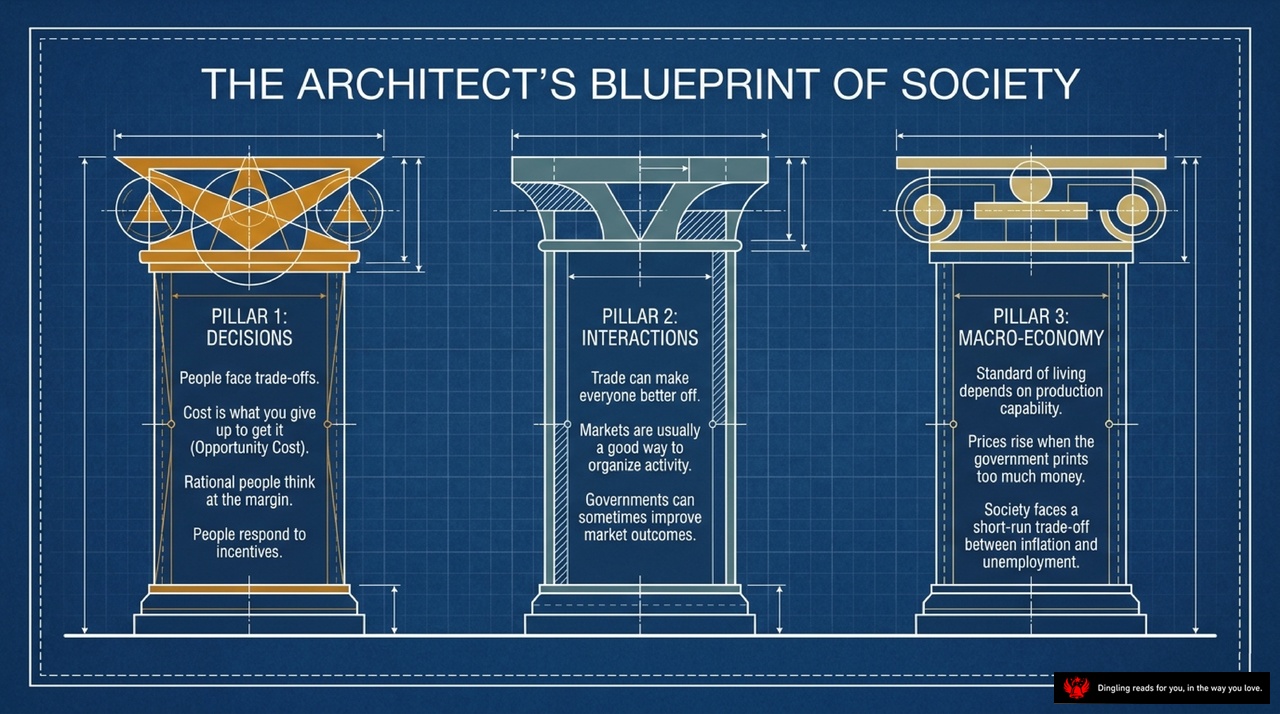
Imagine society not as a chaotic mess, but as a carefully engineered structure—much like an architect's blueprint. Today, we're looking at that blueprint, specifically the three main pillars that hold our economic world together.
First, we have **Pillar 1: Decisions**. Think of this as the foundation of every choice you make. The core idea here is that life is full of trade-offs. You can't have it all; you must choose between studying, working, or playing. Every decision has a cost, known as the **opportunity cost**—it's simply what you give up to get what you want. Whether it's the salary you sacrifice to go to college or the extra hour of sleep you trade for an exam, rational people think at the margin, weighing the extra benefit against the extra cost. And remember, we all respond to **incentives**; change the price or reward, and behavior changes.
Moving to the middle, **Pillar 2: Interactions**. This pillar is all about how we connect with others. The most powerful tool here is **trade**. It's not a zero-sum game where one person wins and another loses; instead, by specializing in what we do best and trading, everyone ends up better off. Markets are usually the best way to organize this activity because they act like a "invisible hand," coordinating resources through price signals. While markets are efficient, sometimes the **government** needs to step in to fix things that don't work on their own, like pollution or monopolies, to improve outcomes for everyone.
Finally, we arrive at **Pillar 3: Macro-Economy**. This looks at the big picture of the entire society. Your standard of living depends entirely on your country's **production capability**—how much we can produce in a given time. But there's a catch: when the government prints too much money, **prices rise**, leading to inflation. We also face a tricky short-term trade-off between **inflation and unemployment**. Trying to lower unemployment often pushes prices up, and vice versa. Understanding this balance is key to managing the economy as a whole.
These three pillars—Decisions, Interactions, and the Macro-Economy—form the essential framework for understanding how our society functions and evolves.

Welcome to the blueprint of how our economy actually functions. Think of society not as a chaotic mess, but as a machine with two distinct, interlocking loops: the physical loop and the financial loop.
On the left, you see **Households**, and on the right, **Firms**. This diagram illustrates the "Inner Loop," which is the physical side of the economy. Households provide the essential ingredients for production—labor, land, and capital—to the **Factor Markets**. In return, **Firms** take these inputs and use them to manufacture goods and services. Once those products are ready, they flow back to households through the **Product Markets**, where we buy them for our daily lives. It's a constant cycle of resources moving from us to businesses and finished goods moving back to us.
But the machine doesn't run on goods alone; it runs on money. Look at the **Outer Loop**, labeled as the Financial loop. This is where the value exchange happens. When firms produce those goods, they pay households for the inputs we provided—this is where you earn wages, rent, and profit. On the flip side, when households buy those goods and services, we are spending our income, and the firms earn revenue. Notice how the flow of goods and money are perfectly opposite, creating a seamless, continuous system of trade.
At the very bottom, the "Architect's Secret" reminds us that economics is all about simplifying reality. By stripping away the noise of government and international trade, this model reveals the essential, continuous mechanics of how money and resources circulate to keep our society alive.

Imagine this: You're looking at the blueprint of how our entire economy actually works. At the heart of this system is a simple but powerful mechanism—the price. As the slide clearly illustrates, prices aren't just numbers on a tag; they are the ultimate architectural signals that guide the allocation of scarce resources across the entire system.
Let's break down how this magic happens. On one side, you have the Law of Demand. This is dictated by your willingness and ability to pay. When the price of something drops, the quantity demanded naturally rises. Think about it: when gas prices tank, everyone suddenly wants to drive more. On the other side, you have the Law of Supply. This is dictated by the costs of production. As the price rises, producers are incentivized to supply more because it becomes profitable to do so.
When these two forces collide, they create the Market Clearing Point. This is the intersection where the demand and supply curves meet. It's the spot where the "invisible hand" truly works its magic. At this exact price, the quantity supplied perfectly matches the quantity demanded. There are no shortages and no surpluses; the market is in perfect balance.
So, why does this matter? Because this equilibrium is where efficiency lives. It shows us exactly how much of a good we should produce and at what price we should sell it to maximize the total benefit to society. Whether it's coffee, cars, or housing, this interaction between buyers and sellers determines the outcome of our daily lives without anyone needing to give direct orders. It's a self-correcting system that constantly adjusts to keep the economy moving forward.
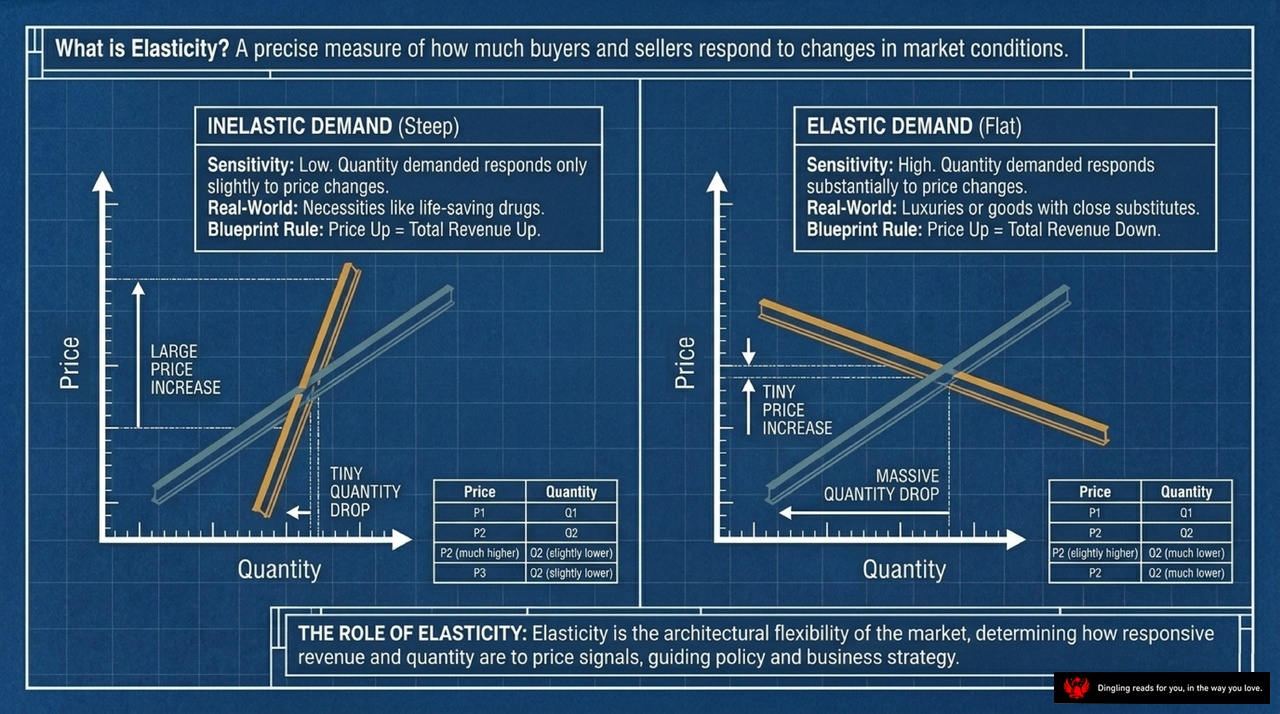
What is elasticity? Simply put, it's the market's thermostat—measuring exactly how much buyers and sellers react when conditions change. Look at these two contrasting blueprints. On the left, we see inelastic demand, represented by that steep line. Think of life-saving drugs or essentials; even if prices skyrocket, people barely change their buying habits. Because quantity drops only slightly while price surges, total revenue actually goes up. That's the rule: price up equals revenue up.
Now, shift your eyes to the right side. This is elastic demand, shown by that flat line. Here, sensitivity is high. If you're selling luxuries or goods with easy substitutes, a tiny price increase triggers a massive drop in quantity demanded. The result? Revenue plummets. The rule flips: price up equals revenue down.
This architectural flexibility isn't just theory; it guides everything from business strategy to public policy. Understanding whether your product is a necessity or a luxury determines how you should price it to maximize value.
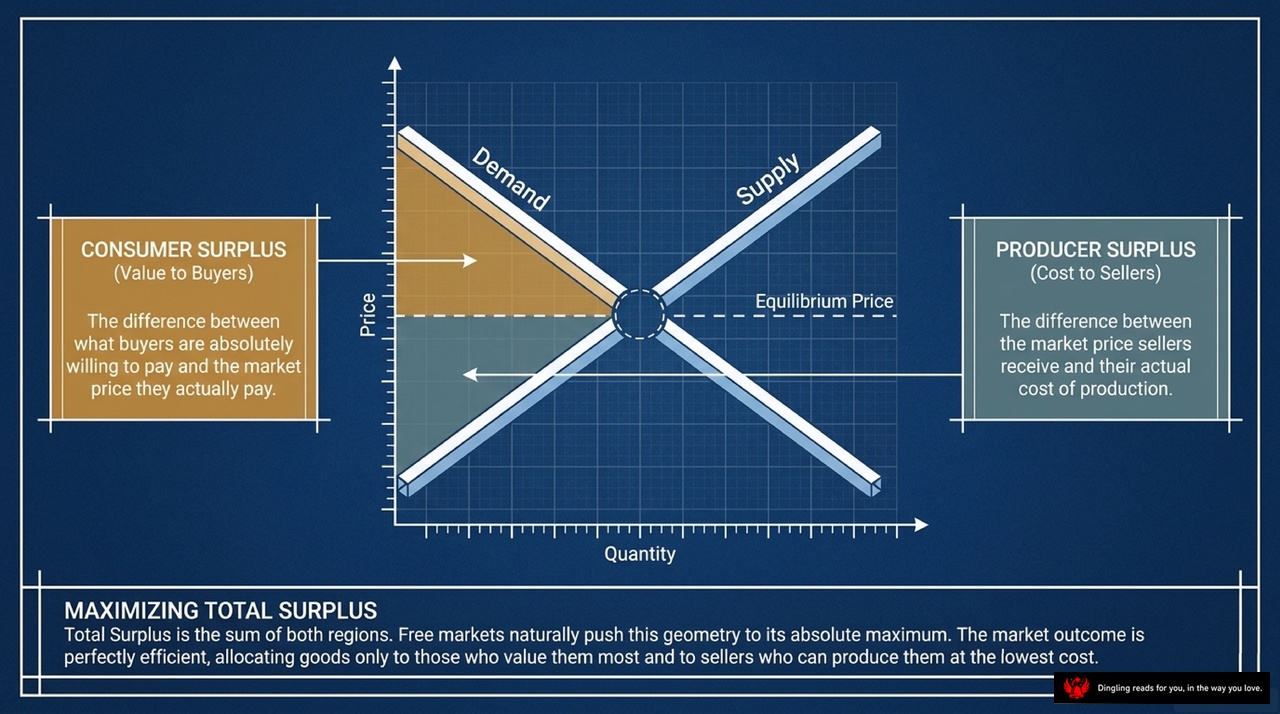
Today's slide breaks down the invisible math behind every dollar you spend and every product you sell. It visualizes the concept of Total Surplus, which is the sum of Consumer Surplus and Producer Surplus.
Look at the golden triangle on the left. That's Consumer Surplus. It represents the value buyers receive—the difference between what they were absolutely willing to pay for a product and the actual market price they ended up paying. Essentially, it's the "extra deal" you get when the market price is lower than your personal valuation.
Now, shift your eyes to the blue area on the right. That's Producer Surplus. This measures the benefit to sellers. It's the gap between the market price they actually receive and their actual cost of production. If you can sell something for more than it costs you to make, that difference is your surplus.
The key takeaway at the bottom is about efficiency. When a free market reaches equilibrium, these two areas combine to maximize Total Surplus. The market naturally pushes this geometry to its absolute limit. It allocates goods to those who value them most and ensures they are produced by sellers with the lowest costs. This perfect alignment is what makes the market outcome so efficient, creating the largest possible economic "pie" for everyone involved.

Now, let's talk about how the government uses taxes to raise money and influence the economy. When the government imposes a tax, it creates what economists call a "tax wedge." As you can see in the diagram, this wedge sits right between the price buyers pay and the price sellers actually receive. This artificial gap shrinks the total size of the market. Because of this distortion, some mutually beneficial trades simply never happen, leading to what we call "deadweight loss"—a permanent fall in total social welfare.
The size of this loss depends on how responsive buyers and sellers are to price changes, which is known as elasticity. The chart highlights "The Determinant": the greater the elasticity, or the flatter the supply and demand curves, the larger the deadweight loss triangle becomes. If demand is very inelastic, like with addictive goods or necessities, consumers bear most of the tax burden, and the market shrinks less. But if demand is elastic, people easily switch to substitutes, the quantity traded drops sharply, and the deadweight loss grows significantly. So, while the government collects "tax revenue" shown in the white box, it often sacrifices more in lost economic activity than it gains, making the efficiency of taxation a critical trade-off in public policy.

Here is the spoken-word script for Slide 7, tailored for an American audience with a natural, engaging tone.
**Slide 7 Script:**
Look at this diagram. It illustrates the real-world cost of protectionism. On the left, we see exporting nations where trade boosts the domestic price above the world level, helping producers while hurting consumers. But on the right, the story gets more complex for importing nations. When governments impose tariffs or quotas, they artificially raise prices above the global market rate. The magnifying glass highlights the hidden cost: a wedge of "tax revenue" goes to the government, but a larger red area labeled "deadweight loss" represents value that simply vanishes from the economy. This is the geometric gain from trade being destroyed. Protectionist policies force the market away from its efficient equilibrium, creating inefficiencies that ultimately reduce the total economic pie for everyone involved.

So, here is the real problem with how markets work on their own: they often miss the bigger picture. Look at this slide. It breaks down two major scenarios where individual actions accidentally hurt or help others without paying the price.
First, we have Negative Externalities, like pollution. Notice the seesaw here. The "Private Cost" is low for the polluter, but the "Social Cost"—the damage to everyone else—is much higher. Because the market only sees the private cost, it produces way too much, creating inefficiency. The fix? The slide suggests "Architectural Fixes" like Pigovian taxes or strict regulations to make polluters pay for that extra social damage.
On the flip side, we have Positive Externalities, like tech spillovers. Here, the "Social Value" is actually higher than the "Private Value." The market under-produces these things because creators don't get paid for all the benefits their invention brings to society. To fix this, we use subsidies or patents to boost production.
Finally, at the bottom, there's the Coase Theorem. It offers a different angle: if private parties can bargain with zero cost, they can solve these externalities on their own without needing government intervention. But in reality, those bargaining costs often exist, which is why we see so much government involvement in our economy.
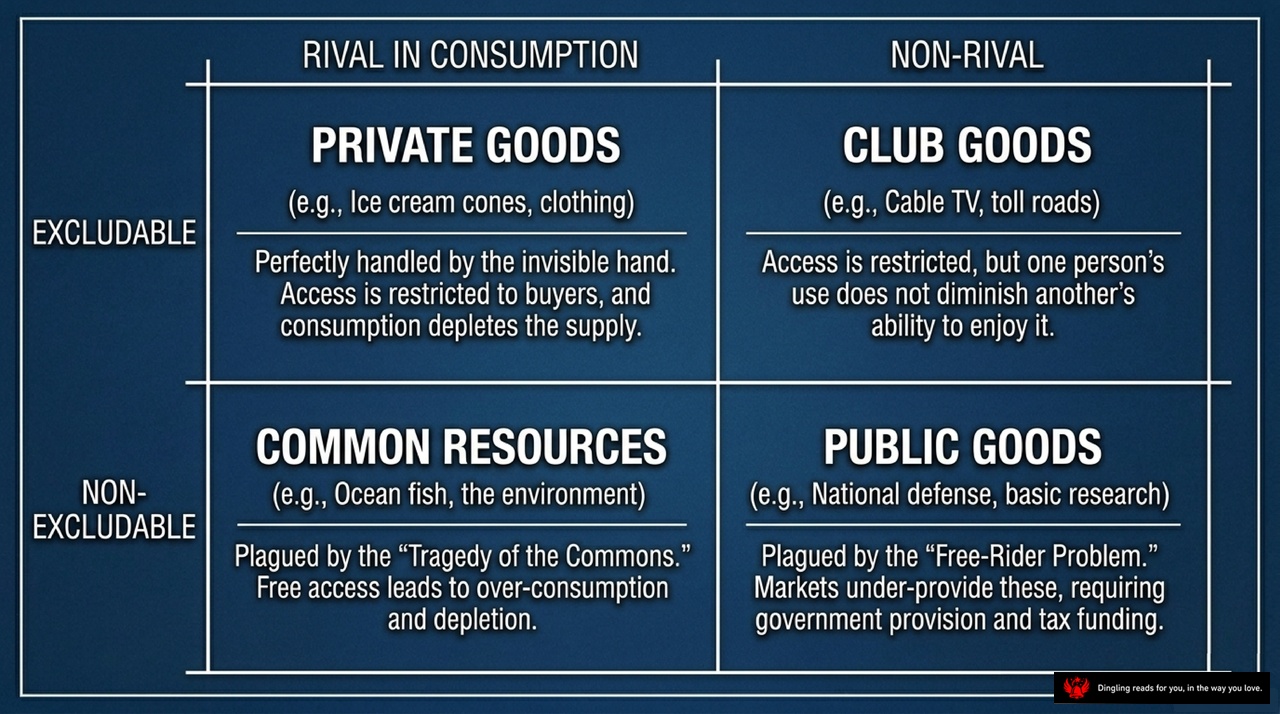
So, let's break down this classic economic framework that categorizes all the goods and services we interact with every single day. As you can see in this grid, everything boils down to two simple questions: Can we stop people from using it? And does one person using it take it away from someone else?
In the top left, we have **Private Goods**. These are the ones we love, like ice cream cones or clothing. They are both **excludable** and **rival**. You can easily stop others from eating your ice cream, and the moment you take a bite, the supply is gone. That's why the "invisible hand" handles these perfectly; if you don't pay, you don't get them, and everyone knows that consuming them depletes the supply.
Move to the top right for **Club Goods**. Think cable TV or toll roads. These are **excludable** but **non-rival**. You can definitely lock people out if they don't pay the fee, but here's the key: one person watching TV or driving on a toll road doesn't stop anyone else from doing the same. Access is restricted, but the enjoyment isn't diminished by others.
Now, look at the bottom left: **Common Resources**. This is where things get tricky, like ocean fish or the environment. These are **non-excludable**—you can't really stop anyone from fishing or polluting—but they are **rival**. If I catch a fish, it's gone for you. This setup leads to the famous "Tragedy of the Commons," where free access leads everyone to over-consume until the resource is completely depleted.
Finally, in the bottom right, we have **Public Goods**, like national defense or basic research. These are the tricky ones because they are **non-excludable** and **non-rival**. Once the military protects the country, no one can be excluded from that safety, and my protection doesn't reduce yours. However, because markets struggle to charge people for these benefits, we face the "Free-Rider Problem," which is why government provision and tax funding are essential here.
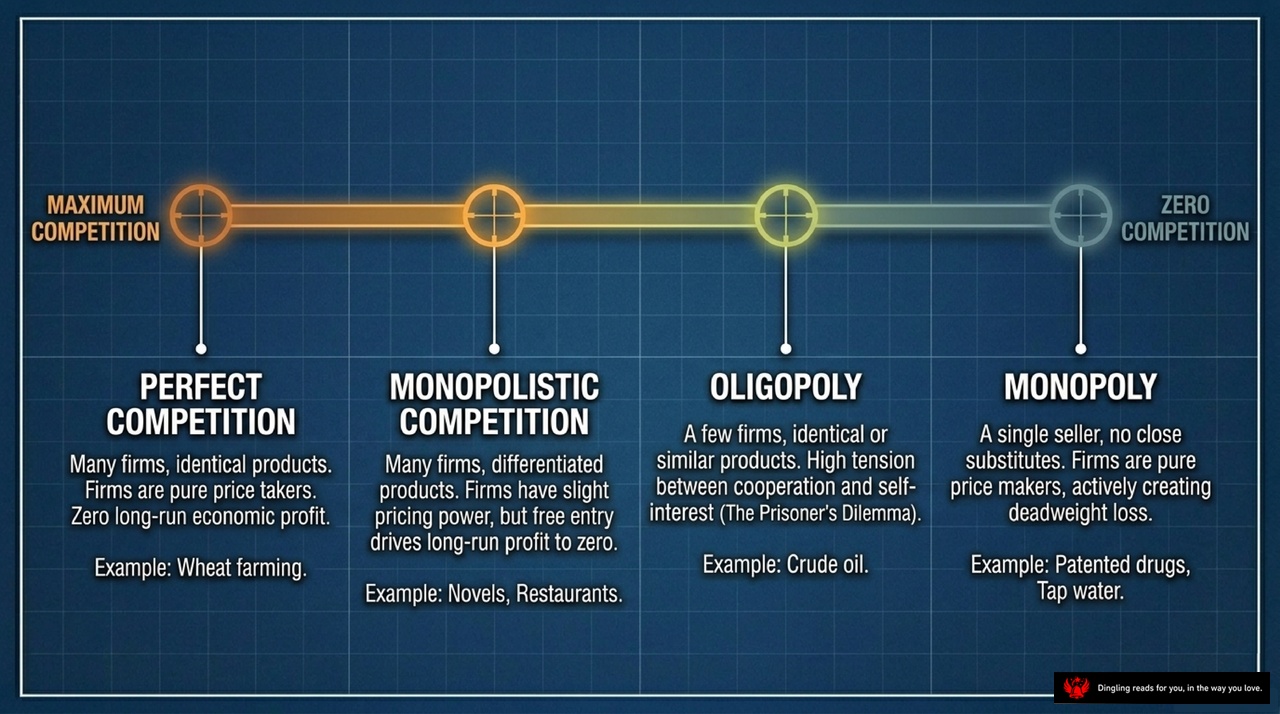
Let's dive into the different structures of markets. As we move from left to right on this timeline, we see competition fade away and market power grow.
On the far left, we have **Perfect Competition**. Think of wheat farming. Here, there are countless firms selling identical products. Because everyone is the same, no single company can set the price; they are just "price takers." In the long run, the competition is so fierce that economic profits disappear completely.
Moving to the middle-left, we find **Monopolistic Competition**. This is where you see restaurants or novel publishers. There are still many firms, but now products are differentiated. A specific restaurant or book brand has a slight edge, giving them a bit of pricing power. However, because it's easy for new competitors to enter the market with similar ideas, those profits eventually get driven back to zero.
Next up is **Oligopoly**. This is the realm of a few dominant players, like the crude oil market. Here, you have only a handful of firms selling similar products. The tension is high because every company's decision directly impacts the others. It's a classic "Prisoner's Dilemma"—they might want to cooperate to keep prices high, but the temptation to cheat for short-term gain is always there.
Finally, on the far right, we hit **Monopoly**, representing zero competition. This is when a single seller controls the market with no close substitutes, like a company with a patented drug or a municipal water system. These firms are pure "price makers." They actively set prices to maximize profit, often creating what economists call "deadweight loss"—meaning the market isn't producing as much as it could for the greater good.
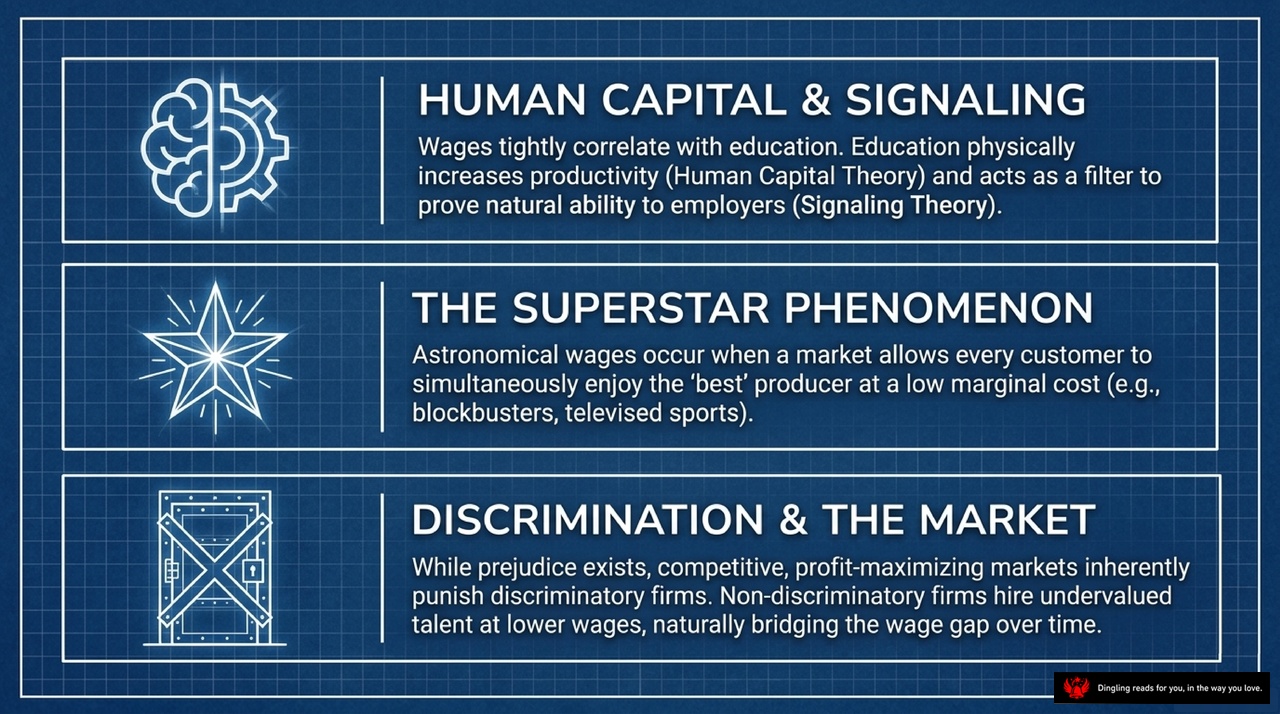
Welcome back. Today, we're diving into three powerful concepts that explain why wages look the way they do and how markets handle inequality.
First, let's talk about Human Capital and Signaling. You've probably noticed that wages are tightly correlated with education. But why? According to the text, there are two main reasons. The first is the Human Capital Theory: education physically increases your productivity, giving you more skills to sell to an employer. The second is Signaling Theory. Even if education doesn't make you smarter, it acts as a filter to prove your natural ability to employers. So, when you see a higher degree, it's either because you became more productive, or it's because you successfully signaled that you are high-quality talent.
Next, consider the Superstar Phenomenon. This explains why some people earn astronomical wages while others with similar skills earn much less. This happens when a market allows every customer to simultaneously enjoy the 'best' producer at a low marginal cost. Think about blockbusters or televised sports. Millions of people can watch the same superstar performance without the cost increasing for each new viewer. This unique market structure allows the top talent to capture a massive share of the revenue, creating huge wage gaps that wouldn't exist in local, face-to-face markets.
Finally, let's look at Discrimination and the Market. It's natural to think that prejudice drives wage gaps, but the text suggests a different dynamic. While prejudice exists, competitive, profit-maximizing markets inherently punish discriminatory firms. If an employer refuses to hire talented people from a certain group, they are paying more for the same work compared to non-discriminatory competitors. Those non-discriminatory firms can hire undervalued talent at lower wages, naturally bridging the wage gap over time. So, in a truly competitive market, the market itself acts as a force against discrimination, even if individual biases persist.

Look at these three shapes: a circle, a triangle, and a square. They represent the three biggest schools of thought on how government should actually run the show. On the left, we have Utilitarianism, championed by John Stuart Mill. Imagine the government as a total utilitarian; its only job is to squeeze every last drop of happiness out of society. It doesn't care about who gets what, only that the total pie of happiness is as big as possible. That's why, from this view, taking money from the rich to give to the poor makes perfect sense. Since money gives you less happiness the richer you are, shifting wealth to the poor actually boosts everyone's total joy.
In the middle, we have Liberalism, or more accurately, Liberal Egalitarianism, led by John Rawls. This approach is all about fairness, but with a twist. Rawls asks us to imagine standing behind a "veil of ignorance"—a blindfold where you don't know if you'll be born rich or poor, talented or not. If you had to design society from behind that blindfold, you'd build a massive safety net. Why? Because you might be the worst-off person tomorrow. This leads to the Maximin Criterion: society should be designed to maximize the well-being of its poorest member. It's not about the total happiness, but about guaranteeing a robust floor for everyone.
Finally, on the right, we have Libertarianism, argued by Robert Nozick. This view is radically different because it cares about the process, not the outcome. For a libertarian, if the rules are fair and everyone voluntarily agreed to them, the resulting distribution is automatically fair. They believe the government's only job is to enforce contracts and punish crimes, but it should never forcibly redistribute income. They argue that equality of opportunity is far more important than equality of outcome. So, even if the result looks unequal, as long as no one was coerced, it's perfectly just.
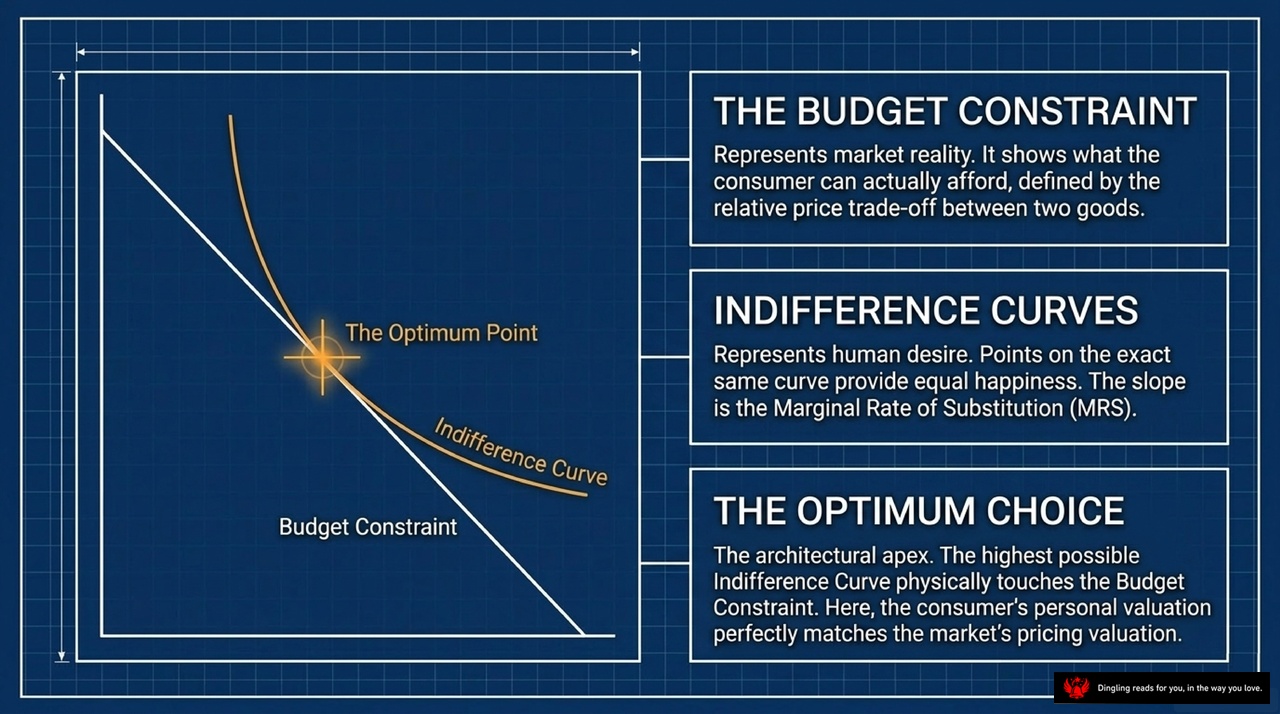
Imagine you have a fixed amount of money to spend on just two things—say, coffee and pastries. Your life is now governed by a simple rule: you can't spend more than what you have. This line on the graph, the **Budget Constraint**, isn't just a math problem; it's a snapshot of market reality. It shows the hard trade-off you face every day. Every dollar you spend on a pastry is a dollar you *cannot* spend on coffee. It defines the absolute limit of what you can afford based on prices.
But while your budget sets the hard boundaries, your desires don't. That's where the **Indifference Curve** comes in. Think of this curved line as a map of your happiness. Every point along this curve represents a different mix of coffee and pastries, but here's the key: they all make you just as happy. You wouldn't trade a point on this curve for a point outside it, but you'd be completely indifferent between any two points right on the line. The steepness of this curve, known as the Marginal Rate of Substitution, tells us how much of one good you're willing to give up to get a little more of the other.
So, how do you decide what to buy? You look for **The Optimum Point**. This is where your personal desire perfectly aligns with market reality. It's the exact spot where the highest possible indifference curve you can dream of physically touches your budget constraint. At this moment, your personal valuation of coffee versus pastries matches exactly with the market's pricing. You've squeezed every last bit of satisfaction out of your budget. This is the architectural apex of consumer choice—where your wallet and your wants finally agree on the best plan.

The market is often called a powerful engine because of that "invisible hand" that balances supply and demand to create wealth. But here's the hard truth: a perfectly efficient market doesn't automatically fix everything. When we look at real life, we see externalities like pollution, monopolies that stifle innovation, and unequal starting points for everyone. These aren't just market glitches; they require careful, calculated intervention.
So, if free markets are so good at allocating resources, why does poverty still exist right next to abundance? The slide asks a critical question: what is our ultimate responsibility in shaping the rules of the game? We can't just stand back and let the market do its job. Sometimes, when the system fails to deliver fairness or efficiency, it's up to us to step in and correct the course.