
The Logic of Economy Operation: Complete Chapter-by-Chapter Summary

Welcome to today's session on "The Logic of Economic Operation." Imagine you're holding a blueprint for understanding China's economy. This isn't just about charts or numbers; it's about decoding the hidden mechanics behind inflation, asset bubbles, and macroeconomic cycles.
Our framework rests on three pillars. First, we look at how production capacity expands and contracts. Second, we analyze how these shifts trigger a massive revaluation of assets like stocks and real estate. Finally, we examine the specific drivers of inflation in a developing economy.
By connecting these dots, we move from simply observing history to actually predicting where the market is going next. Let's dive into how this logic works in practice.
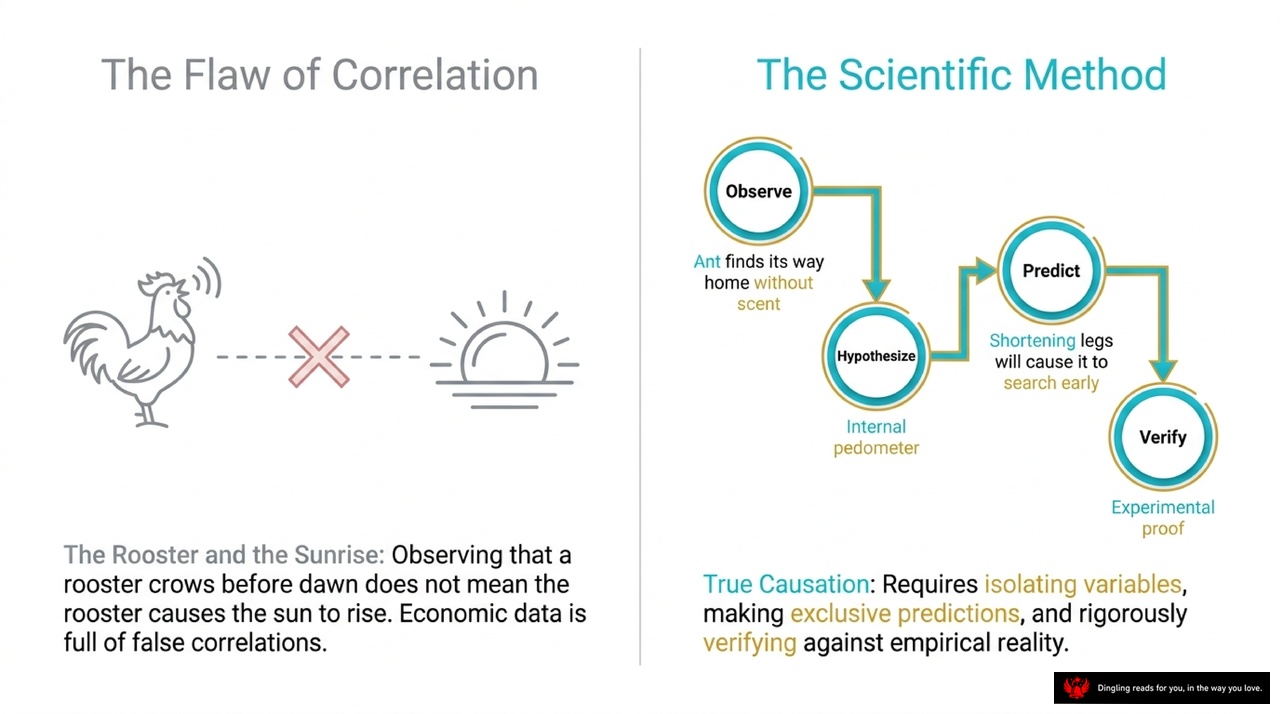
Today's slide breaks down a critical distinction that separates true scientific progress from everyday assumptions: the difference between correlation and causation. On the left, we see the classic "Rooster and the Sunrise" example. Just because the rooster crows before dawn doesn't mean the rooster causes the sun to rise; they are merely correlated events driven by a third factor—Earth's rotation. In economics, mistaking these false correlations for cause-and-effect relationships is one of the most dangerous traps we face.
To avoid this flaw, we must adopt the Scientific Method shown on the right. It's not just about observing patterns; it's about a rigorous four-step cycle. First, we **Observe** an anomaly, like an ant finding its way home without scent. Next, we **Hypothesize** a logical explanation, such as the idea of an internal pedometer. Then, we **Predict** specific, exclusive outcomes—if we shorten the ant's legs, it should search early; if we lengthen them, it should overshoot. Finally, we **Verify** through experimental proof. Only by isolating variables and rigorously testing against empirical reality can we claim true causation. Without this disciplined approach, we risk building theories on sand rather than solid evidence.

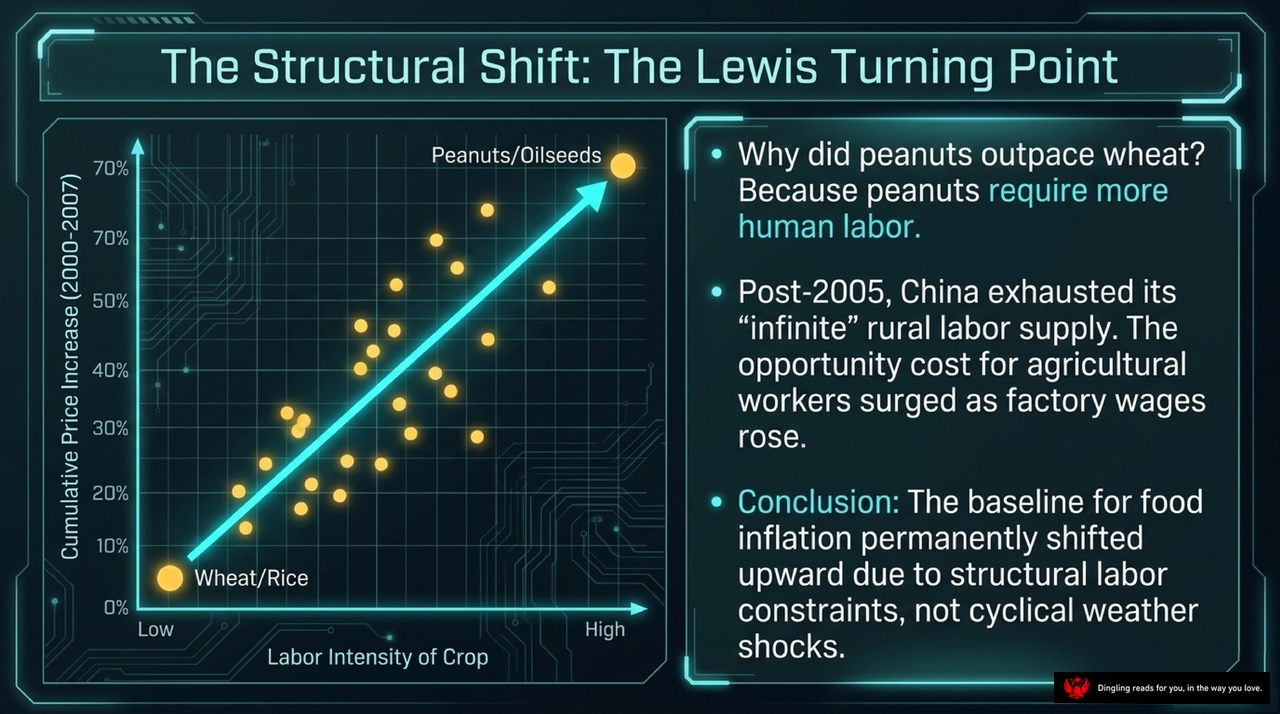
When we look at the macroeconomic variables shaping inflation, the contrast between mature Western economies and China's reality is striking. In the West, the Phillips Curve reigns supreme: inflation is driven by wage stickiness and labor market tightness. But in China, the story is different. The core driver of consumer prices isn't just labor costs; it's food prices, agricultural labor costs, and farmer inflation expectations.
This difference extends to producer prices. While Western economies are driven by domestic consumption cycles, China's PPI is globally synchronized. It's dictated by the "Law of One Price," global industrial demand, and the US Dollar exchange rate. This means Chinese inflation is deeply entangled with the rest of the world.
Finally, consider the primary constraints on the economy. Mature economies are limited by human capital—labor supply. China, however, faces a shortage of physical capital: limits on infrastructure capacity and capital stock. This fundamental structural difference explains why China's inflation dynamics don't always follow the standard Western playbook. Understanding these distinct drivers is essential for diagnosing the true nature of inflation in the Chinese context.

Let's dive into the mechanics of China's economic engine by looking at the "Tradable Goods Engine" and the concept of global synchronization. As this slide illustrates, starting from 1996, China's industrial prices stopped moving in isolation and began to lock step with the rest of the world. Why? Because of the "Law of One Price." Once China opened its current account, arbitrage opportunities erased price differences for tradable goods. If you can buy a commodity cheaper in one country and sell it in another, that price gap disappears instantly.
The diagram breaks down exactly what drives this synchronization. Three main forces feed directly into the Chinese Producer Price Index: OECD industrial output, the US Dollar exchange rate, and global commodity shocks. In simple terms, China's industrial prices are no longer determined just by domestic policy; they are exogenously set by global demand and currency fluctuations. You can see this in the chart above, where the "Data Gold" and "White" lines converge after 1996, showing how arbitrage smoothed out the gaps.
Think of it this way: when global demand for industrial goods shifts, or when the dollar strengthens or weakens, China's PPI reacts almost immediately. Even the non-tradable sectors eventually get pulled into this rhythm because these industrial inputs become the building blocks for everything else. So, instead of trying to predict China's economy in a vacuum, you have to watch the global industrial cycle and the dollar. The data clearly shows that once the door opened in 1996, China's economic heartbeat became synchronized with the global rhythm, making the world's industrial output the primary driver of Chinese inflation and growth.

Let's dive into the mechanics of how asset prices actually move, moving beyond simple supply and demand into the realm of balance sheet psychology.
The core framework here is the Asset Revaluation Theory, which starts by simplifying the economy into two distinct blocks: the financial sector and the real economy. In this system, every individual or firm faces a fundamental constraint: their sources of funding must always equal their uses of funds. On the source side, you have new domestic credit from banks and your current national income. On the use side, you have consumption, cash reserves for daily operations, and various asset allocations like stocks, bonds, and real estate.
The theory posits that asset prices don't just float on thin air; they adjust to maintain this equilibrium when external shocks hit. Imagine a company deciding how much inventory or fixed assets to hold. If their expected return on investment rises, they want to invest more. To fund this expansion, they pull liquidity out of the financial market. This increased demand for capital drives up borrowing costs, suppresses equity valuations, and reduces the overall money available for speculative assets. Conversely, if inflation expectations rise or the economy slows, companies might hoard cash or cut back on investment. This frees up liquidity, which flows into asset markets, pushing up the valuations of stocks, bonds, and real estate.
We can see this logic play out clearly in historical cycles. Take the period from 2005 to 2007. During this time, China's economy was characterized by a massive release of total supply. As capital stock expanded rapidly, the marginal return on investment dropped, causing corporate investment意愿 to decline. This surplus of capital that wasn't being absorbed by the real economy flowed into financial markets. The result? A synchronized boom across the board. Bond yields plummeted, stock valuations skyrocketed from 15 to 70 times earnings, and real estate prices accelerated. It was a classic asset revaluation driven by a lack of real investment outlets.
On the flip side, look at the 2008 financial crisis. The global shock caused a sharp contraction in real demand. Companies slashed investment, hoarding cash to survive. This massive withdrawal of funds from the real economy created a flood of liquidity in the financial sector. Even though corporate earnings were collapsing, asset prices initially surged because there was simply too much cash chasing too few assets. This explains why we saw a decoupling between falling earnings and rising stock indices in the immediate aftermath of the crisis.
Understanding this mechanism is crucial because it reveals that asset bubbles aren't always about irrational exuberance or bad fundamentals; often, they are the inevitable mathematical result of where the money flows when the real economy's appetite for capital changes. Whether it's a boom driven by excess capital seeking a home or a bust driven by a desperate need for cash, the balance sheet tells the story.
Analysts are often expected to be crystal-ball gazing prophets, but in reality, their true role is far more grounded: they are the market's translators and sentinels. Think of them not as fortune tellers, but as interpreters who take complex data, policy signals, and corporate earnings details, then translate them into a clear narrative that investors can actually understand. They keep a close eye on market sentiment, constantly scanning for hidden risks and emerging opportunities.
However, many investors make a critical mistake: they confuse an analyst's research with a guarantee of precise prediction. This expectation creates an unrealistic burden on the industry and amplifies the inevitable contradictions in their work. The truth is, predicting the future with high accuracy is fundamentally limited by the complexity of economics and markets. Macro trends are influenced by countless variables—policy shifts, global events, and unexpected shocks—that no model can fully capture. Similarly, industry dynamics and individual company decisions are often unpredictable.
We see this limitation in action every day. Competitions like the "Vision Cup" show that consistently accurate predictors are incredibly rare. Most forecasts only hold up in specific environments; once the underlying market logic shifts, errors expand rapidly. This isn't a failure of skill, but a reflection of the market's non-linear and inherently unpredictable nature.
Beyond these structural limits, the analyst industry faces its own internal challenges. On one side, the business model of sell-side analysts often ties their compensation to client referrals. This can distort their independence, pushing them to tailor conclusions to short-term client preferences or market hype rather than objective truth. Reports sometimes become "content wars," using complex models to wrap up simple ideas or chasing short-term trends at the expense of long-term logic.
On the other side, technology is reshaping the landscape. As big data and AI take over traditional data collection, analysts risk becoming mere "tool users" if they don't pivot. The future belongs to those who can move beyond data processing to deep insight and logical construction. Analysts must embrace these tools to boost efficiency, but they must focus their energy on the depth of thinking and understanding of human behavior that machines simply cannot replicate.
To survive and thrive, the industry needs to return to its core: objective, independent, and deep research. It's time to stop obsessing over short-term rankings and start valuing the quality of logic and the contribution to long-term industry understanding. By building better evaluation systems and leveraging technology wisely, analysts can reclaim their true professional value in the capital market.

Today's slide breaks down the diagnostic framework we use to measure a country's economic capacity, specifically through the lens of the Current Account. Think of this graph as a battlefield where Domestic Demand and Domestic Supply are constantly pushing and pulling against each other, with the Global Price acting as the fixed line of fire.
On the left, you see the "Demand Shift." If domestic demand expands to the right, our economy starts importing more. This eats up our surplus, causing the Current Account Surplus to shrink. Conversely, on the right, we have the "Supply Shift." If domestic supply expands—meaning we produce more efficiently or build more factories—the surplus grows, and we start exporting the extra output.
The shaded blue area represents that Current Account Surplus, or net exports. By observing these trade surpluses alongside domestic prices, we can actually isolate whether a nation's physical capital is expanding or contracting. It's a powerful tool: if we see a growing surplus paired with stable prices, it signals that our productive capacity is increasing. This framework helps us cut through the noise and understand the true engine driving an economy's growth.

Today's slide breaks down the "Capacity Cycle," illustrating two distinct eras of capital formation: the Supply Expansion from 2005 to 2007, and the Supply Contraction from 2008 to 2012.
Let's start with the first era, 2005 to 2007, depicted on the left. During this period, we saw massive prior investments coming online, which significantly expanded the total supply of goods and services. The graphic shows arrows radiating outward from the factories, symbolizing this surge in output. As supply outpaced demand, we saw GDP growth accelerating while inflation remained low and stable. This abundance of goods allowed China to drive excess production abroad, resulting in a rapidly expanding trade surplus. However, despite this growth, profit margins were squeezed because the sheer volume of supply kept prices in check. The diagnosis here is clear: the economy was fueled by a rapid release of capacity.
Now, look at the right side, covering 2008 to 2012. This era represents a sharp shift to Supply Contraction. Following the global financial crisis, manufacturing capital expenditure plummeted. Instead of building new capacity, factories slowed down, and the supply curve effectively moved to the left. The visual shows arrows converging inward, indicating a tightening of supply. Because supply growth slowed much faster than demand, domestic inflation pressures began to rise. Interestingly, while GDP growth decelerated and the trade surplus shrank, profit margins actually expanded. This counterintuitive result happened because the scarcity of goods allowed companies to raise prices, even as the overall economy cooled.
In summary, the 2005-2007 cycle was driven by an oversupply of goods that suppressed inflation but boosted exports, whereas the 2008-2012 cycle was defined by a supply squeeze that fueled inflation and protected margins, despite a slowing economy. Understanding this flip-flop between supply expansion and contraction is crucial for decoding the behavior of asset prices and economic cycles.

Welcome back to our deep dive into asset revaluation. Today, we're zooming in on the engine that drives market prices: the corporate balance sheet.
Think of the economy as a massive plumbing system. On the left, you see "Funds Sourced"—the inflows. This comes from two main pipes: "Operating Income" and "Credit Expansion." These are the raw materials entering the system. They merge into a central channel labeled "Data Gold," representing the flow of capital ready for deployment.
Now, look at the right side: "Funds Used," or the outflows. The water splits into three directions. First, it flows straight into "Consumption." Second, it goes to "Financial Assets" like stocks and real estate. And third, it heads toward "Physical Capex."
Here is the critical mechanism on your slide: notice the valve labeled "Physical Capex" is currently set to "CLOSED." This represents a scenario where expected returns on physical investment are low. When companies see that building factories or buying equipment won't yield good profits, they shut the valve on capital expenditure.
What happens when that valve closes? The liquidity doesn't disappear; it has to go somewhere. The slide captures this perfectly with the text at the bottom: "Corporate balance sheets dictate asset prices. When physical investment yields drop, liquidity must find a home in financial markets."
Because the "Physical Capex" valve is closed, the "Data Gold" flows entirely into the "Financial Assets" pipe. This surge of trapped liquidity inflates the prices of stocks and real estate, even if the underlying economy isn't necessarily growing faster. This is the core logic of asset revaluation: when real investment stalls, money chases financial assets, driving their prices up. Understanding this shift from the macro flow of funds to the micro decision of a company closing its investment valve is key to predicting where the market is heading.
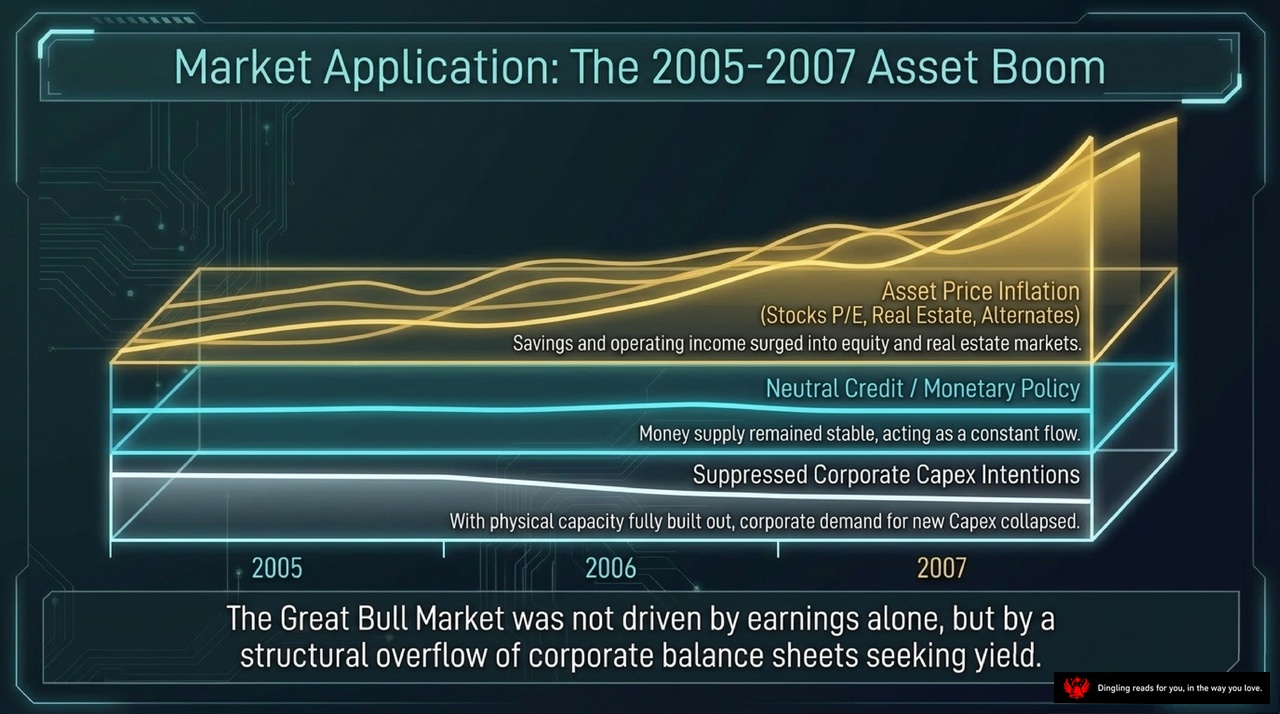
The Great Bull Market of 2005 to 2007 wasn't just about companies printing profits. It was a structural overflow of corporate balance sheets seeking yield. Look at the chart: at the very bottom, you see "Suppressed Corporate Capex Intentions." By 2005, physical capacity was fully built out, so corporate demand for new investment collapsed. That freed up massive amounts of cash sitting on balance sheets.
Above that, we have "Neutral Credit / Monetary Policy." The money supply remained stable, acting as a constant flow into the system. But since companies weren't investing, that liquidity had nowhere to go but up.
The result? "Asset Price Inflation." Savings and operating income surged into equity and real estate markets. You see the lines for Stocks P/E, Real Estate, and Alternates all climbing steeply from 2005 through 2007. The market didn't rise because earnings were exploding; it rose because corporate savings were looking for a place to park themselves. It was a classic case of structural liquidity finding its home in assets, not in production.

Market Application: The 2009-2010 Stimulus Shock. Picture this: the global economy is in a deep slump, demand has collapsed, and earnings prospects are grim. This is the wall we hit. But then, governments and central banks slam an arrow of aggressive credit expansion right into that wall. This is the 2009-2010 stimulus shock.
Here's where it gets interesting. That massive injection of liquidity doesn't flow into the struggling real economy or the sluggish stock market, because the outlook is just too bad. Path A, equities, sees sluggish, capped P/E expansion. The money simply bypasses the broken machinery of the real economy.
Instead, the flood of capital seeks refuge. It flows directly into Path B: Alternative Assets. Specifically, it hits real estate and hard assets like gold and commodities. Why? Because when industrial yields are near zero, investors have nowhere else to go but assets that hold value. The massive flood of credit bypasses the crash and floods directly into these safe havens, driving their prices to new highs. This is the exact mechanism we saw in 2009. When the economy freezes, credit doesn't save the business; it saves the balance sheet by inflating alternative assets.
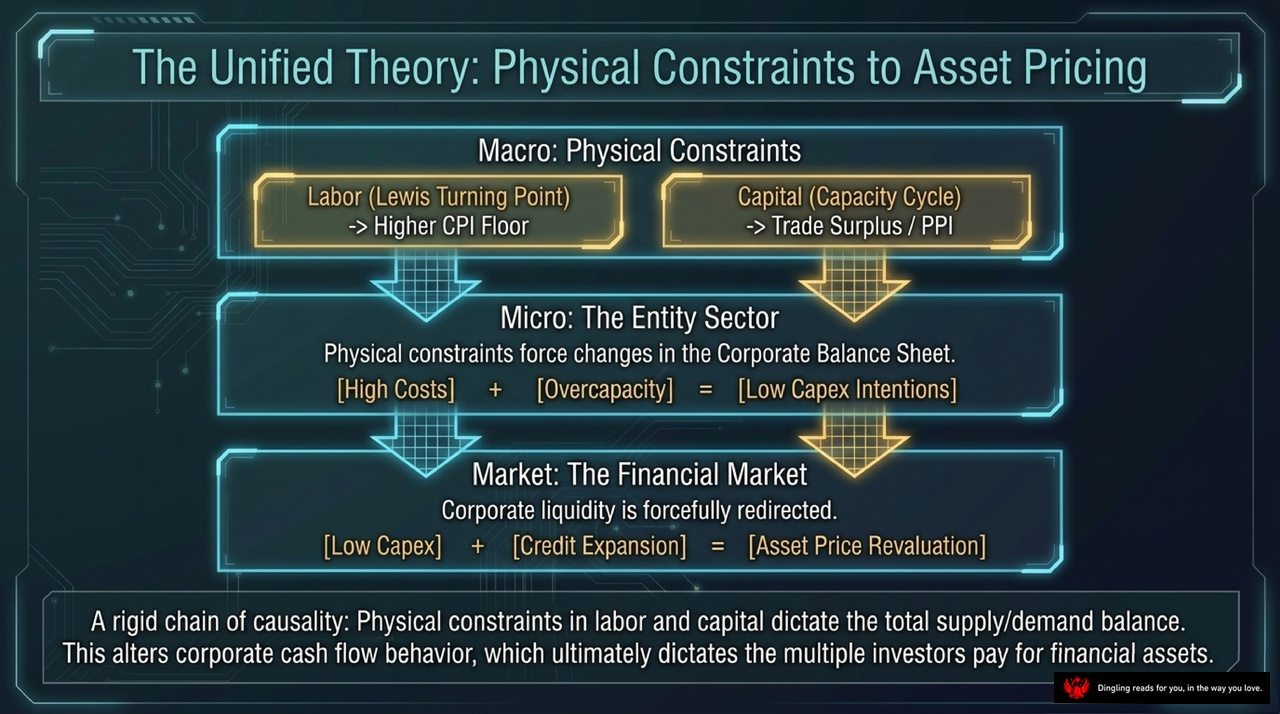
Today's slide outlines the "Unified Theory of Physical Constraints," a framework that connects the real economy directly to asset prices. Think of it as a rigid chain of causality starting from the physical world and ending at your investment portfolio.
At the macro level, we look at two key physical constraints: Labor and Capital. On the left, we have the "Lewis Turning Point." As labor becomes scarce, wages rise, creating a higher floor for inflation. On the right, we see the "Capacity Cycle." As capital becomes constrained, trade surpluses shrink and producer prices, or PPI, get pushed higher.
These physical pressures flow down to the micro level, specifically impacting the corporate balance sheet. When companies face high costs and overcapacity, their response is simple: they cut back on investment. The slide clearly shows this equation: High Costs plus Overcapacity equals Low Capex Intentions. Companies simply stop buying new machines and expanding factories because the physics of the economy no longer supports it.
Finally, this forces a massive shift in the financial market. Because companies are cutting investment, their cash doesn't disappear; it gets forcefully redirected. This surplus cash, combined with credit expansion, flows into financial assets like stocks and bonds. The result is a revaluation of asset prices. In short, when the physical economy tightens, corporate cash flows pivot, and that extra liquidity inflates asset prices. This is the core logic linking real-world constraints to the financial markets.

So, we've reached the final synthesis of our macro framework. Let's pull it all together.
First, look at the macro realities. China's inflation isn't just a monetary story; it's dictated by the structural Lewis Turning Point and the global synchronization of tradable goods. We've seen how the shift from infinite labor to rising wages fundamentally altered the cost structure, while the one-price law ensures that global industrial demand drives domestic prices in lockstep.
Next, consider the hidden cycle of capacity over demand. By tracking the current account surplus, we reveal a truer diagnostic than Western demand-side models. When physical capital formation slows, liquidity inevitably seeks refuge, inflating assets. This mechanical result of corporate balance sheet adjustments explains why financial markets boom and bust in rhythm with real investment.
Finally, ask the critical question: If China has permanently crossed the Lewis Turning Point, and the era of unchecked capital expansion is over—where will the overflowing liquidity of the corporate balance sheet seek refuge next? The answer lies in understanding that when physical Capex becomes unviable, money doesn't disappear; it simply revalues assets. This is the core of our asset revaluation theory.