
The Signal and the Noise: Complete Chapter-by-Chapter Summary
Welcome to today's session on "The Signal and the Noise" by Nate Silver. This book serves as a visual manifesto for finding the truth in our Big Data era, powered by the discipline of probabilistic thinking. We often mistake noise for signal, but Silver teaches us that real insight comes from understanding uncertainty, not pretending to eliminate it. By embracing probability and constantly updating our views with new evidence, we can cut through the chaos of modern life—from financial markets to weather patterns—and make decisions that are not just lucky guesses, but calculated moves toward the truth.

Look at this slide. It captures a profound truth about our modern world: the Information Explosion Paradox. The core message is simple but often overlooked—more data does not equal more truth. In fact, the amount of useful information is a relative constant, but the noise grows exponentially faster than the signal.
Let's look at the timeline on the left, starting in 1440. This is when the printing press was invented. It slashed the cost of a book by 300 times, sparking the Enlightenment. But it also fueled centuries of bloody sectarian wars by accelerating the spread of propaganda and heresy. So, even back then, simply making information cheaper didn't automatically make us smarter or safer; it just made the noise louder.
Now, fast forward to today, on the right side of the screen. We generate a staggering 2.5 quintillion bytes of data daily. This massive influx triggers our biological defense mechanisms. Instead of helping us find the truth, our brains instinctively filter for information that confirms our pre-existing beliefs. We are drowning in data, yet we are becoming more polarized and less informed.
The lesson here is clear: in an age of infinite data, our biggest challenge isn't gathering information—it's distinguishing the signal from the noise and resisting the urge to only hear what we want to hear.
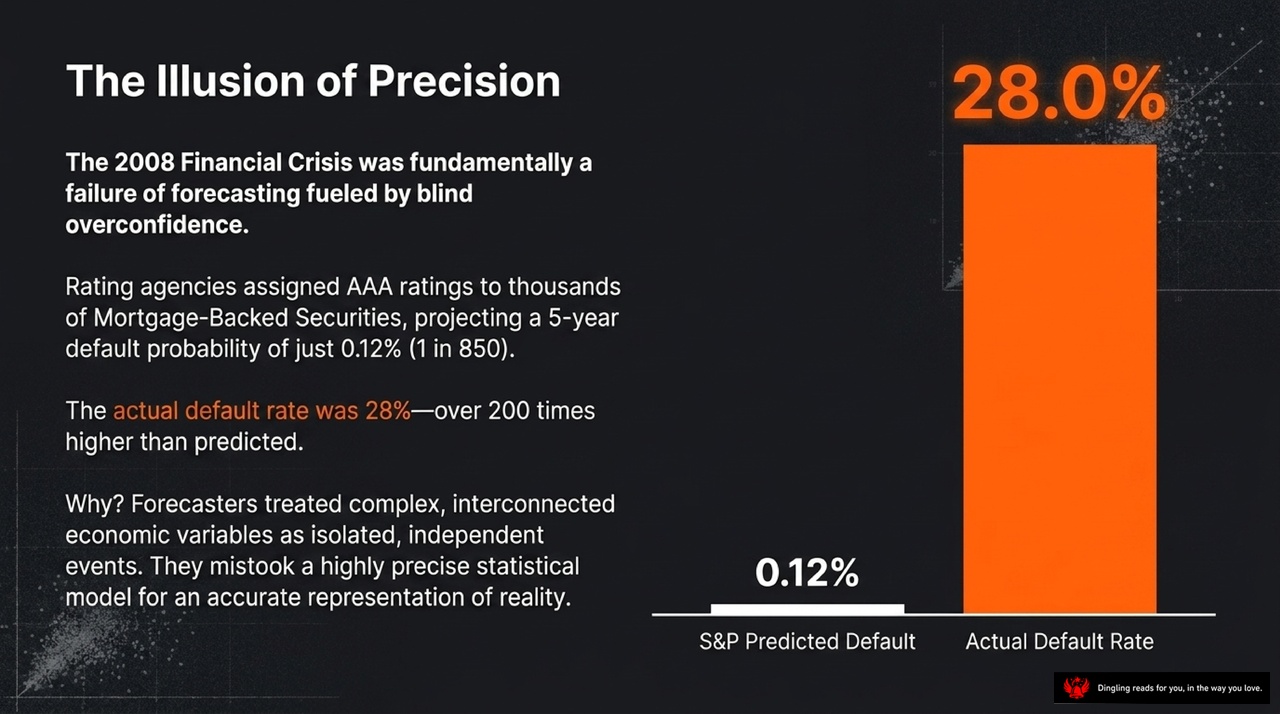
The illusion of precision is a dangerous trap, and the 2008 Financial Crisis is the perfect case study. Look at this stark contrast on the screen: the S&P predicted a default rate of just 0.12%, essentially assuming that out of 850 bonds, only one might fail. Yet, the reality was a catastrophic 28% default rate—more than 200 times higher than anyone dared to predict.
Why did this happen? It wasn't a lack of data; it was a failure of logic. The rating agencies treated complex, interconnected economic variables as if they were isolated, independent events. They mistook a highly precise statistical model for an accurate representation of reality. They confused "risk," which is quantifiable, with true "uncertainty," which cannot be measured. By forcing uncertainty into a false box of certainty, they created a collective hallucination. When that illusion shattered, the entire financial system collapsed, proving that when profit becomes the only compass, the cost of being wrong is paid by everyone else.
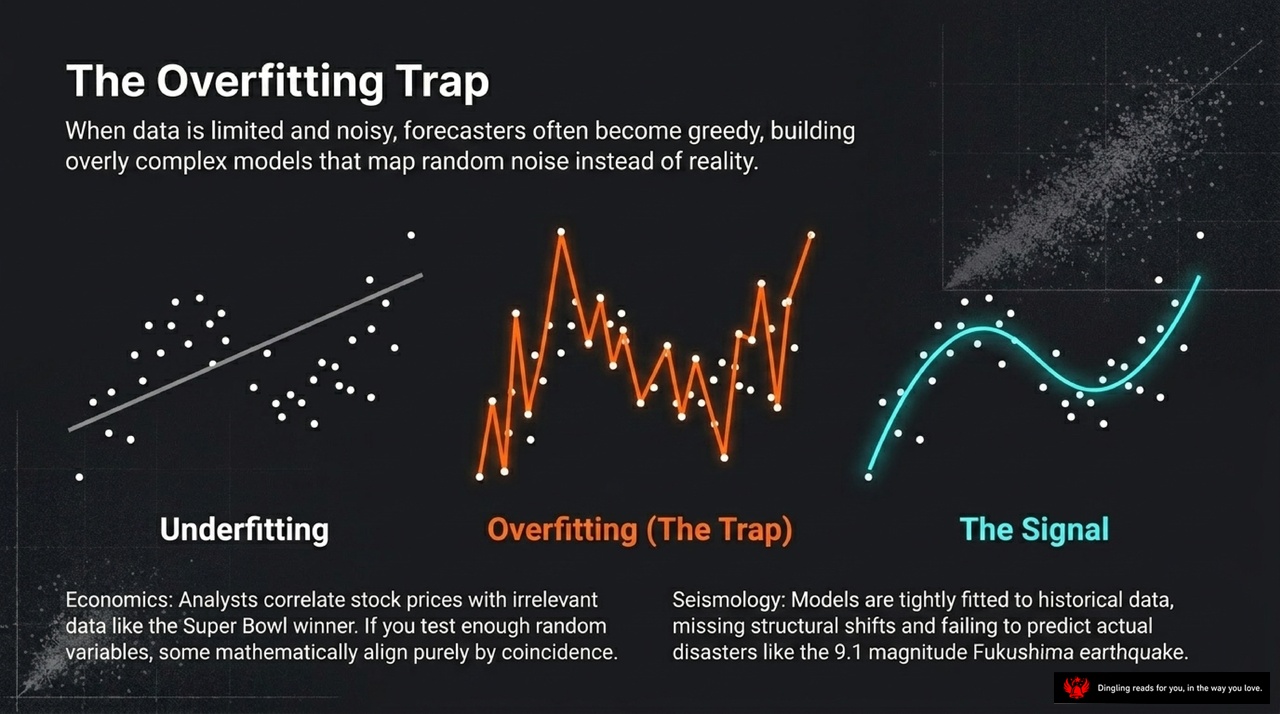
Imagine you're trying to predict the next big earthquake, but instead of looking at the big picture, you get so obsessed with matching every tiny wobble in the past data that your model starts seeing patterns that aren't there at all. This is the "Overfitting Trap," and it's one of the most dangerous mistakes a forecaster can make.
Look at the three curves on this slide. On the left, you have "Underfitting"—the model is too simple, missing the real trend entirely. On the right, you have "The Signal"—a clean, smooth curve that actually captures the underlying reality. But right in the middle? That jagged orange line is the trap. It's an overly complex model that has memorized the random noise in the historical data instead of finding the true signal. It fits the past perfectly, which makes you feel confident, but it fails miserably when predicting the future.
This isn't just a math problem; it's a human behavior problem. When data is limited or messy, forecasters often become greedy. They build these overly complex models because they think, "If I include enough variables, I'll be right." But as the slide illustrates, this greed backfires. In economics, analysts might correlate stock prices with completely irrelevant data, like who won the Super Bowl, just because the numbers happened to align by pure coincidence. In seismology, models get so tightly fitted to historical data that they miss structural shifts. That's exactly what happened with the 9.1 magnitude Fukushima earthquake. The models were so focused on fitting past patterns that they failed to predict the actual disaster, leading to catastrophic consequences.
The lesson is clear: don't confuse noise with signal. A good model doesn't need to be the most complex one; it needs to be simple enough to ignore the random fluctuations and focus on the real, predictable trends. Otherwise, you're just building a beautiful cage for yourself that looks perfect on paper but collapses the moment reality hits.
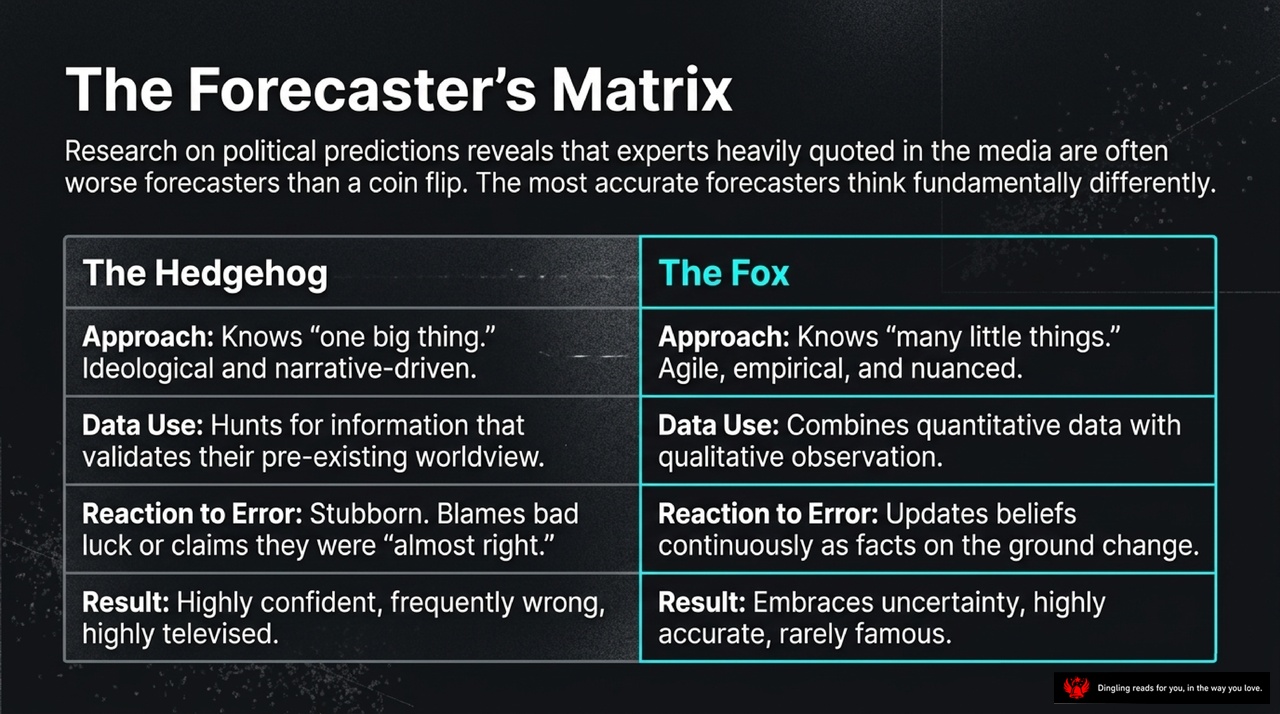
The Forecaster's Matrix reveals a stark divide between how we think about the future. On one side, you have "The Hedgehog"—the experts who dominate the headlines. They rely on one big, overarching theory, driven by ideology and narrative. They hunt for data that confirms their worldview and, when they're wrong, they stubbornly blame bad luck or claim they were "almost right." The result? They are highly confident, frequently wrong, and constantly on TV.
On the other side stands "The Fox." This is the approach of the most accurate forecasters. They know many little things rather than one big thing. Their method is agile, empirical, and nuanced. Instead of clinging to a single worldview, they combine quantitative data with qualitative observation. When facts on the ground change, they update their beliefs continuously. They embrace uncertainty rather than pretending to have all the answers. The result? They are highly accurate, but rarely famous.
History shows us that the media's favorite experts are often worse forecasters than a coin flip. To predict the future effectively, you must stop acting like a stubborn Hedgehog and start thinking like a flexible Fox.
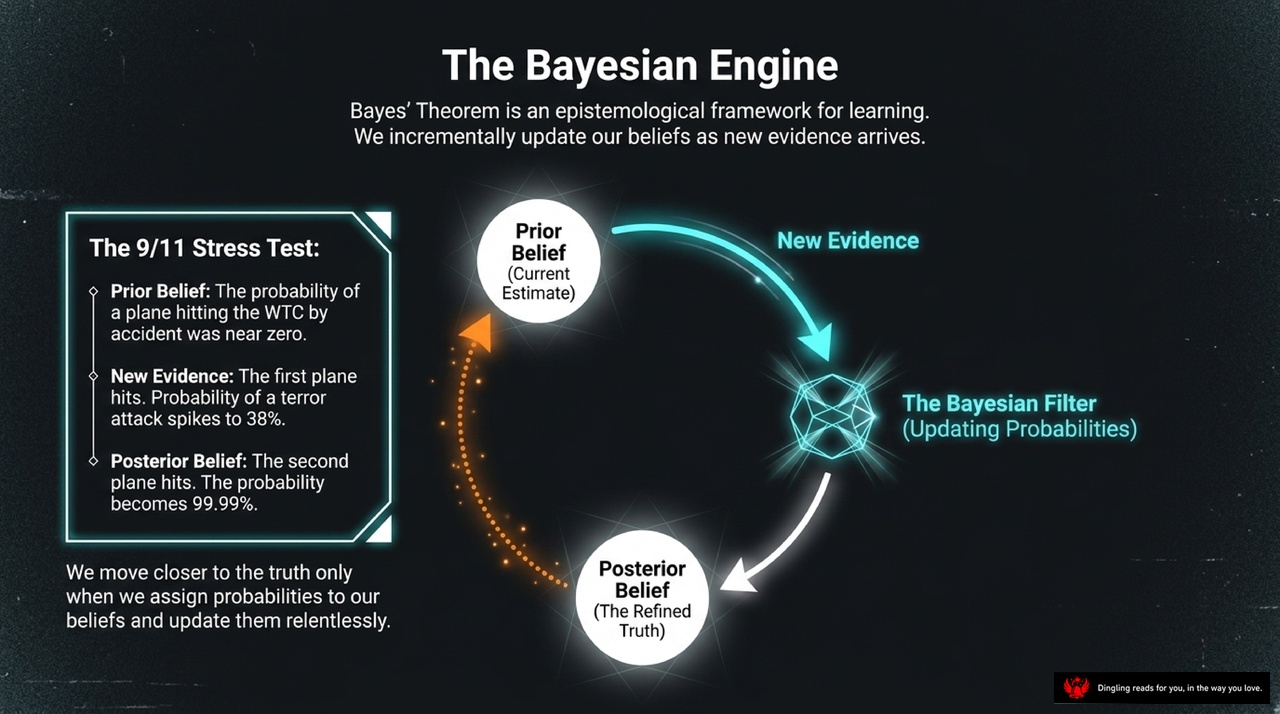
Imagine you are sitting at a high-stakes poker table, the air thick with tension. You hold a pair of eights, and the odds are clear: your opponent has a better hand only 3% of the time. But then, they call your bet. Suddenly, that probability shifts. You update your belief. This is the essence of the Bayesian Engine, and it's the very logic we need to master to navigate a world full of uncertainty.
As the slide illustrates, Bayes' Theorem isn't just a math formula; it's an epistemological framework for learning. It teaches us that we incrementally update our beliefs as new evidence arrives. Look at the cycle: we start with a Prior Belief, our current best estimate. Then, New Evidence arrives, acting as the filter that forces us to recalibrate. The result is a Posterior Belief—a refined truth that is closer to reality than our initial guess.
Let's bring this to life with the "9/11 Stress Test" shown here. Before the attacks, our Prior Belief was that a plane hitting the World Trade Center by accident was near zero. That was our baseline. Then, the first plane hit. That was our New Evidence. The Bayesian Filter instantly updated our probability, spiking the chance of a terror attack to 38%. We didn't panic blindly; we adjusted our belief based on the data. But the engine didn't stop there. When the second plane hit, we took that as even stronger evidence. Our Posterior Belief skyrocketed to 99.99%. We moved closer to the truth not by knowing everything upfront, but by assigning probabilities to our beliefs and updating them relentlessly.
This dynamic process is the antidote to the static, often wrong predictions that plague our world. Whether it's predicting the stock market, climate change, or the next global crisis, clinging to an initial guess is a recipe for disaster. True intelligence lies in this continuous loop: observe, update, and refine. By embracing the Bayesian way, we stop fighting reality and start learning from it, turning uncertainty into a manageable, navigable path forward.
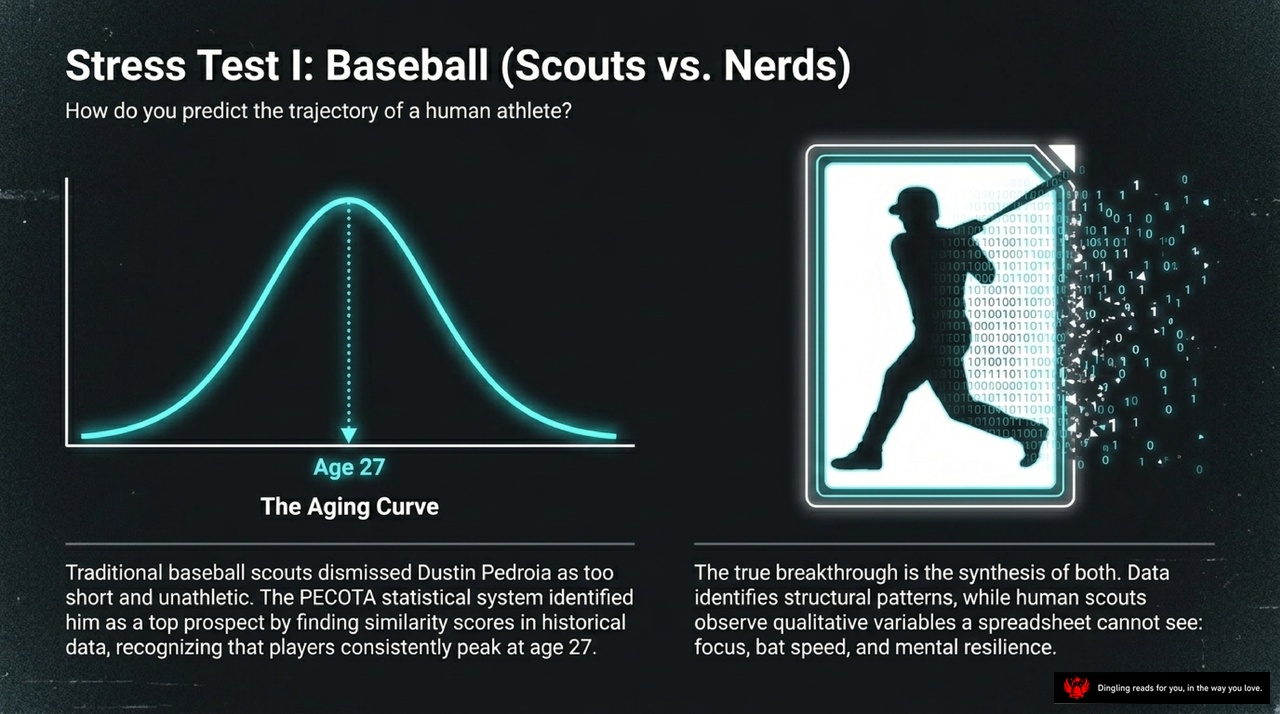
Imagine you're trying to predict the future trajectory of a human athlete. You have two competing teams: the traditional scouts who rely on gut feeling, and the "nerds" who trust data. This slide captures that exact tension. On the left, you see the "Aging Curve," a bell-shaped line peaking at age 27. This represents the biological reality that most athletes burn out after their mid-twenties. On the right, we see a baseball player dissolving into binary code, symbolizing the shift from human observation to algorithmic analysis.
Traditional scouts often dismissed players like Dustin Pedroia because he was too short and lacked athletic flash. But the PECOTA statistical system saw something they missed. By matching Pedroia's data against historical patterns, the system identified him as a top prospect, correctly predicting he would peak right at that age 27 mark. This was a breakthrough because it synthesized both worlds. The data identified the structural patterns of aging, while human scouts could still observe the qualitative variables a spreadsheet simply cannot see: focus, bat speed, and mental resilience.
The lesson here is that the best predictions don't come from choosing between experience and data. They come from combining them. The aging curve gives you the timeline, but the human element gives you the nuance. In a world obsessed with metrics, we often forget that the intangible qualities of a player—and by extension, any complex system—remain the final arbiters of success.

Welcome back to our deep dive into the limits of prediction. Today, we're tackling one of the most chaotic systems on Earth: the weather.
Look at this stunning visualization of a hurricane. It represents what meteorologists call a "chaotic system." Here's the hard truth: in these systems, tiny errors compound massively. A butterfly flapping its wings in Tokyo can theoretically change the storm's path in London. This is the "Butterfly Effect" in action, and it means perfect long-term forecasting is mathematically impossible.
But here is the good news: despite this inherent chaos, human ingenuity has found a way forward. Notice the title on your screen: "Chaos & Vision." While supercomputers are incredible—they calculate 77 trillion operations per second—they lack imagination. They are brilliant at crunching numbers but terrible at spotting the subtle, abstract patterns that define a storm's soul.
This is where humans come in. We possess a highly evolved visual cortex capable of instantly spotting anomalies. Meteorologists don't just trust the machine's output; they visually inspect the computer-generated charts. They can see a subtle shift in a pressure system or a strange cloud formation that an algorithm might miss. This human-in-the-loop approach has been a game-changer. Over the last 25 years alone, hurricane landfall accuracy has improved by a staggering 300%.
However, we must be careful. There is a major caveat right here at the bottom: commercial pressure destroys accuracy. Local TV forecasters often exhibit a "wet bias." Why? Because predicting rain when it doesn't rain is seen as a minor mistake, but missing a major storm and letting people get wet is a career-ending disaster. To avoid viewer anger, forecasters often deliberately predict rain to play it safe. This trade-off sacrifices scientific truth for audience retention, reminding us that even in a field driven by data, human incentives can still skew the results.
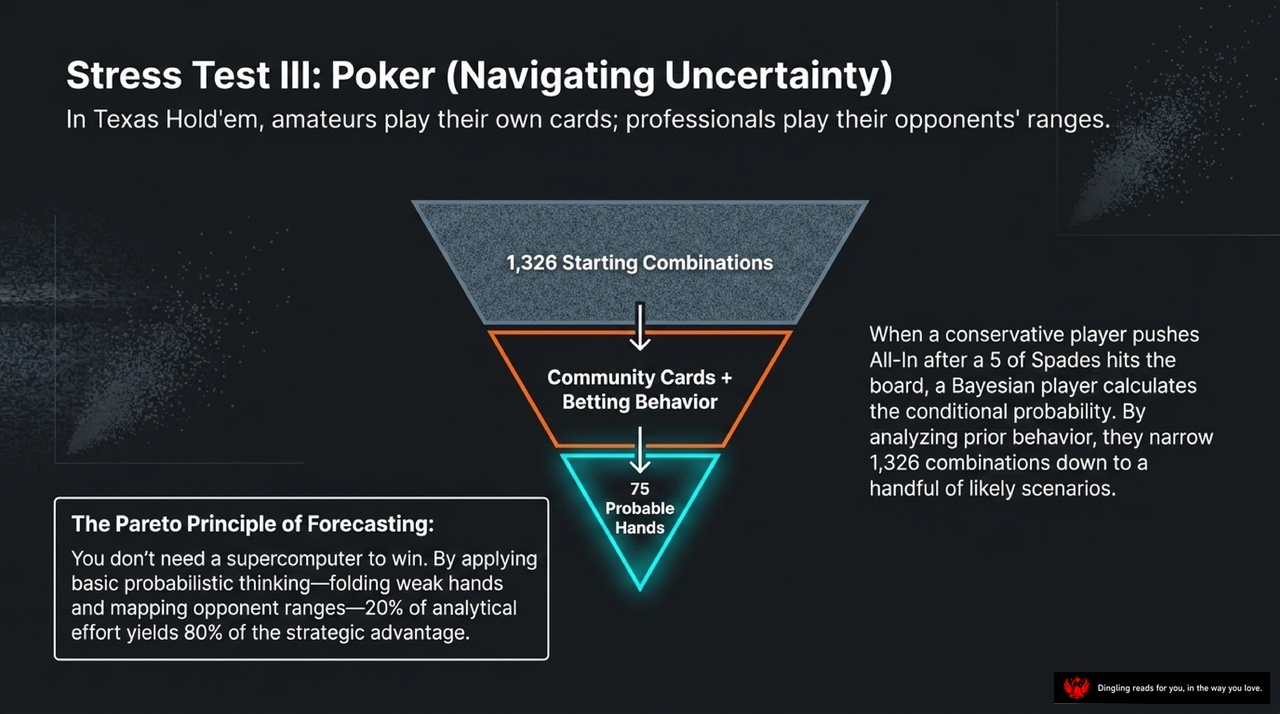
Imagine you're sitting at a high-stakes Texas Hold'em table. The difference between a casual gambler and a professional isn't the cards they hold—it's how they read the room. Amateurs play their own cards; professionals play their opponents' ranges.
Look at this funnel. It starts with 1,326 possible starting combinations. But when community cards hit and betting behavior unfolds, a Bayesian player doesn't panic. Instead, they calculate conditional probability. By analyzing prior behavior, they narrow those 1,326 possibilities down to just 75 probable hands. This is the Pareto Principle of Forecasting in action: you don't need a supercomputer to win. By applying basic probabilistic thinking—folding weak hands and mapping opponent ranges—20% of your analytical effort yields 80% of the strategic advantage.
This mindset is crucial because the world is full of uncertainty, not just risk. In poker, you can't predict the exact outcome, but you can navigate the odds. When a conservative player pushes All-In after a 5 of Spades hits the board, a smart player adjusts their model instantly. They realize the opponent's range has shifted dramatically. They aren't guessing; they are updating their belief based on new evidence.
This is exactly how we should approach life's biggest challenges. Whether predicting market crashes, climate shifts, or geopolitical events, the goal isn't to be right every time. It's to build a system where your decisions have the highest expected value. By constantly refining your view of reality as new information arrives, you turn chaos into a game you can play with confidence.
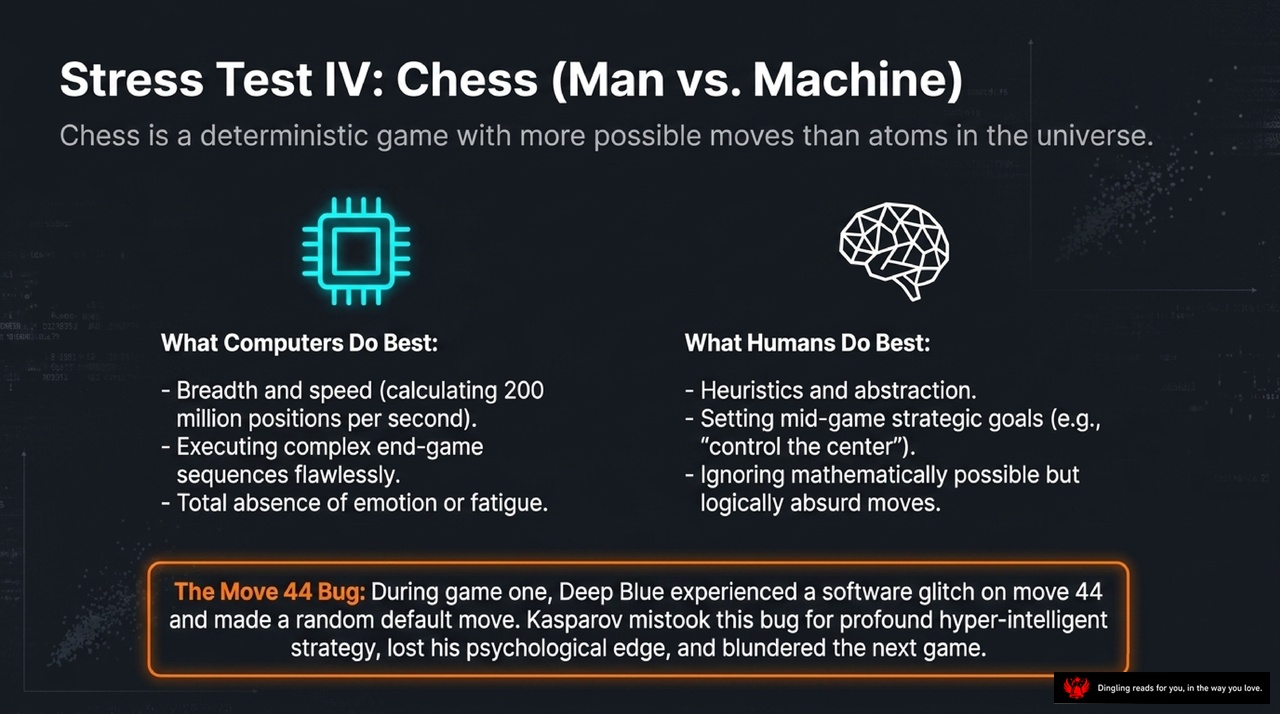
Chess is a game so vast that the number of possible moves exceeds the atoms in the entire universe. Yet, when pitting man against machine, we see two very different strengths collide. On one side, we have the computer's superpower: sheer breadth and speed. Machines can calculate 200 million positions per second, executing flawless end-game sequences without a single flicker of emotion or fatigue. They don't get tired; they don't doubt.
On the other side, we have the human advantage: heuristics and abstraction. While a computer might get lost in the math, humans excel at setting strategic goals like "control the center" and, crucially, we can ignore moves that are mathematically possible but logically absurd. We understand the game's soul, not just its statistics.
But even the greatest machine isn't immune to failure. Consider the infamous "Move 44 Bug." During their first match, Deep Blue suffered a software glitch and made a random default move. Kasparov, the world champion, misinterpreted this glitch as a profound, hyper-intelligent strategy. This moment shattered his psychological edge, leading him to blunder the next game. It's a stark reminder that in the battle of prediction, even the most advanced logic can be undone by a single error or a moment of misperception.
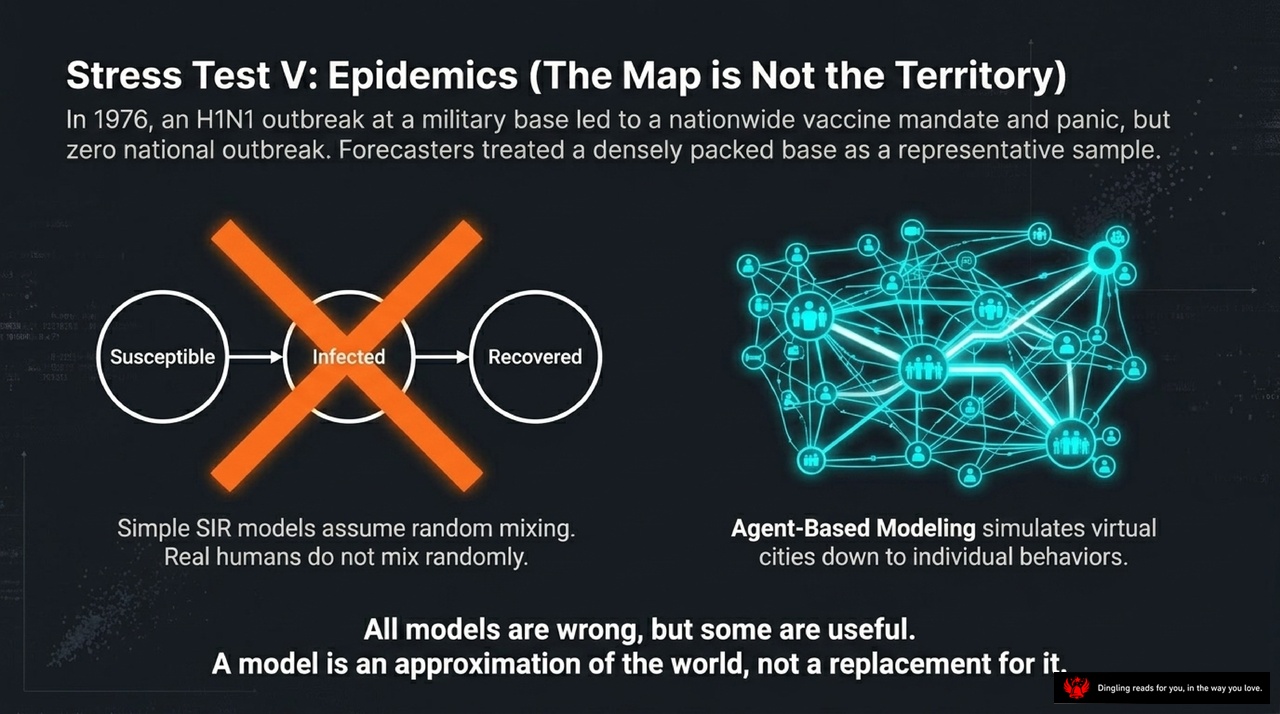
Imagine you're trying to predict the next big wave in an epidemic. In 1976, forecasters made a critical mistake during an H1N1 outbreak at a military base. They treated that densely packed base as if it were a perfect representative sample of the entire nation. The result? A nationwide panic and a vaccine mandate for zero actual national outbreaks. It was a classic case of confusing the map with the territory.
The slide highlights why this happened by contrasting two modeling approaches. On the left, you see the simple SIR model, which assumes people mix randomly—Susceptible, then Infected, then Recovered. But real humans don't mix randomly; they cluster in social networks, families, and workplaces. That's why that simple arrow-based model gets a big red X. It fails to capture the complexity of human behavior.
On the right, the solution is Agent-Based Modeling. Instead of assuming random mixing, this approach simulates virtual cities down to individual behaviors, connecting people in a web of real social relationships. It accounts for the fact that an infection spreads differently through a tight-knit community than it does across a whole country.
This brings us to a profound truth at the bottom of the slide: all models are wrong, but some are useful. A model is just an approximation of the world, not a replacement for it. When we ignore the messy reality of how people actually interact, our predictions crumble. The lesson is clear: to predict epidemics accurately, we must stop relying on oversimplified assumptions and start modeling the actual network of human connections.

Why did 9/11 shock the intelligence community? Because humans have a hard time distinguishing between "unfamiliar" and "impossible." We suffer from what we call "Unknown Unknowns"—events so rare and unexpected that our brains simply refuse to consider them as likely.
Look at this graph. If you plot terrorist attacks on a standard linear graph, 9/11 looks like a massive, unpredictable outlier—a freak accident that no model could have seen coming. But here is the crucial insight: when you plot these attacks on a double-logarithmic scale, a clear, straight line emerges. This is the Power-Law Curve.
This curve reveals a terrifying mathematical reality. The failure to predict terrorism isn't a lack of data; it is a failure of imagination. We ignore the underlying mathematics of infrequent, high-impact events. The graph shows that while small attacks happen frequently, the probability of a massive, catastrophic event drops sharply, yet it never hits zero. 9/11 wasn't an anomaly; it was just the next logical point on this curve. By failing to visualize this distribution, we created a blind spot where the very worst-case scenarios could happen.
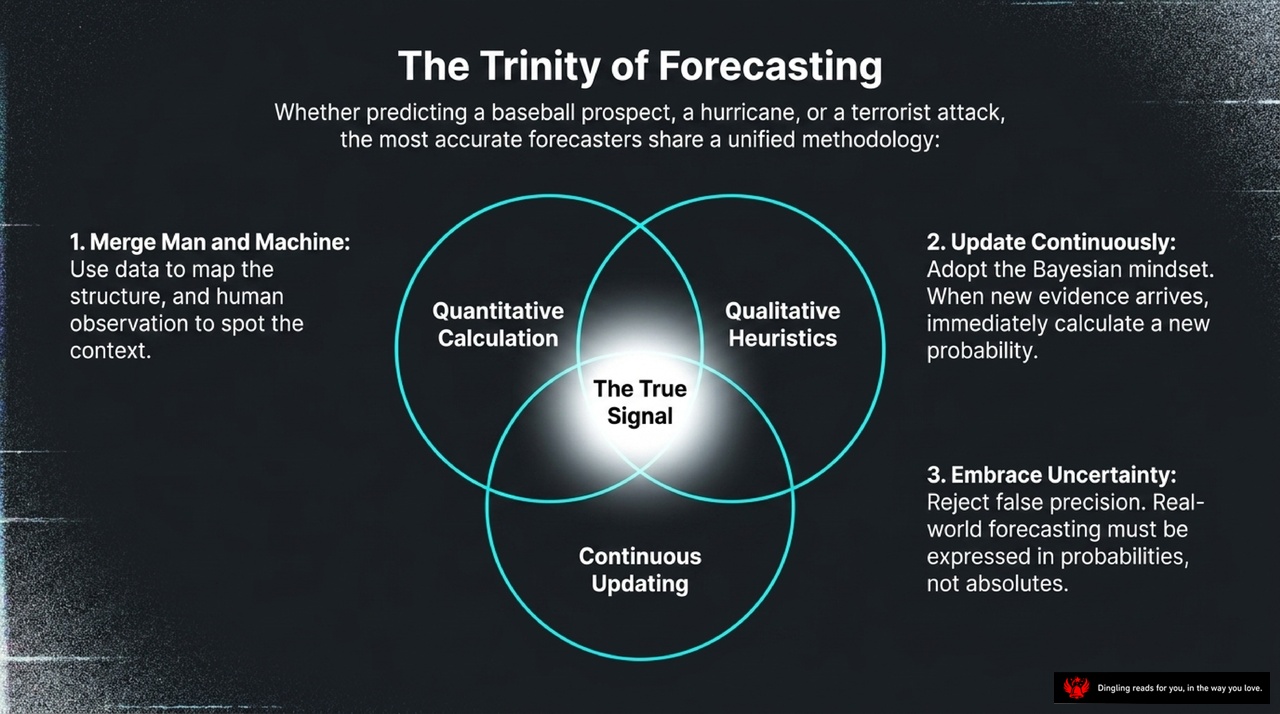
So, what do the world's best forecasters actually have in common? Whether they're predicting a baseball prospect, a hurricane, or a terrorist attack, the most accurate ones share a unified methodology known as "The Trinity of Forecasting."
First, you must merge man and machine. As the slide illustrates, the true signal lies at the intersection of quantitative calculation and qualitative heuristics. You need data to map the structure, but you also need human observation to spot the context. That's why human forecasters can often outperform pure algorithms by catching subtle patterns or anomalies that a computer might miss.
Second, you have to update continuously. Adopt a Bayesian mindset. When new evidence arrives—whether it's a new poll number, a sudden weather shift, or a breaking news story—you must immediately recalculate your probability. Refusing to update your view when reality changes is the fastest way to become obsolete.
Finally, and perhaps most importantly, you must embrace uncertainty. Reject false precision. Real-world forecasting isn't about declaring absolutes; it's about expressing things in probabilities. A good forecaster knows that the future is messy and will always assign a range of likelihoods rather than a single, guaranteed outcome. By balancing hard data with human insight, constantly updating your beliefs, and accepting that you can never know everything for sure, you move closer to the truth.

The pursuit of the signal is a pursuit of the truth. In an era drowning in quintillions of bytes of data, the noise will always outpace the signal. Our biological instinct is to use information to validate our biases, building overfitted models that map the noise rather than reality. To forecast accurately, we must first admit our own inherent fallibility. We must think like foxes, synthesize data with context, and rigorously update our beliefs in the face of new evidence. Are you updating your beliefs to reflect reality, or are you twisting reality to protect your beliefs?