
This Time Is Different: Complete Chapter-by-Chapter Summary

Welcome to a journey through eight centuries of financial folly. The image before you captures the core thesis of our book, *This Time Is Different*. It suggests that the belief that "this time is different" is the oldest, most dangerous illusion in economic history.
Throughout history, from the ancient financial ledgers shown in the background to today's digital stock charts, humanity has repeatedly fallen into the same trap. We convince ourselves that crises are happening to others, in other times, or in other countries. We believe we are smarter, better managed, and have learned from past mistakes. We assume old valuation rules are obsolete and that our unique innovations make us immune.
But the data tells a different story. We have compiled an 800-year quantitative dossier proving that this optimism is always followed by disaster. Whether it was the global boom of the 1920s leading to the Great Depression, or the advanced financial systems of the 2000s culminating in the Global Financial Crisis, the pattern remains unchanged. The hubris of believing in our own invincibility is what drives us to the brink. History does not repeat itself exactly, but it often rhymes, and the lesson is clear: the illusion of safety is the greatest risk of all.
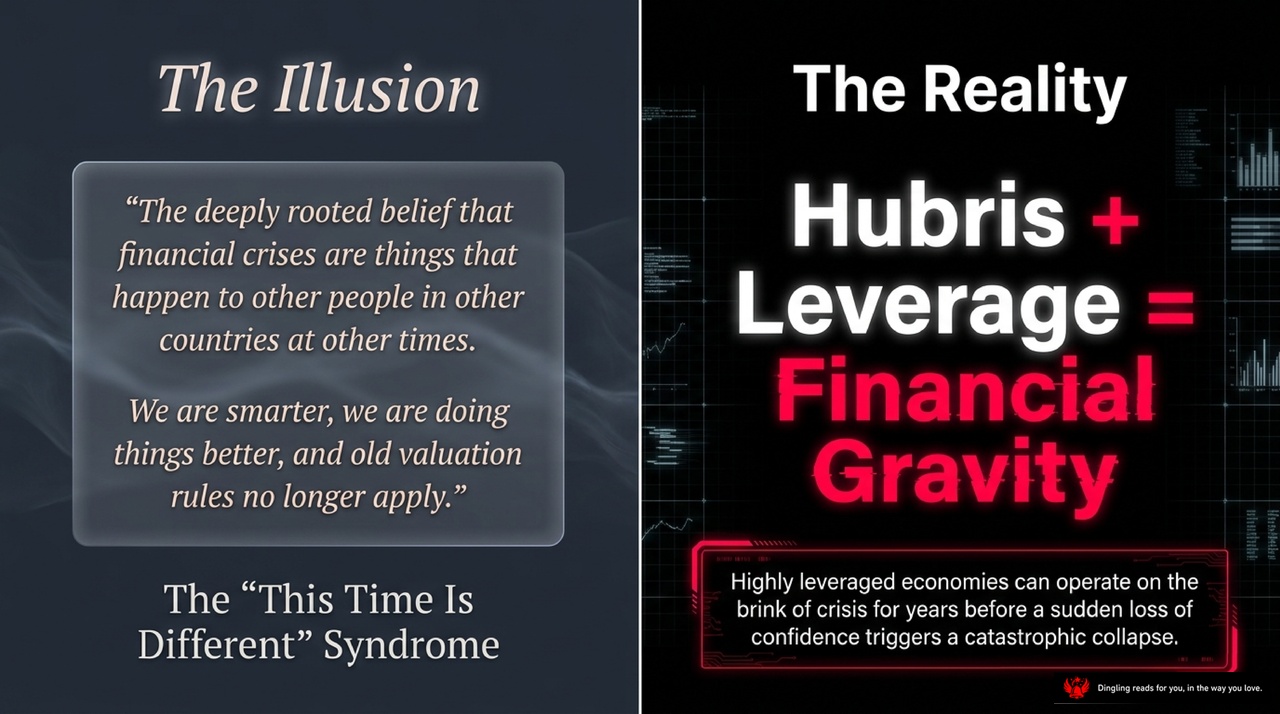
The "This Time Is Different" syndrome is a dangerous illusion that has plagued every generation of investors and policymakers. It's the comforting, deeply rooted belief that financial crises are events that happen to other people, in other countries, at other times. We convince ourselves that we are smarter, that we are doing things better, and that old valuation rules simply no longer apply to us. But history, as this slide starkly contrasts, tells a very different story.
On the left, we see the illusion: the arrogance of thinking we have evolved beyond the mistakes of the past. On the right, we see the reality: Hubris plus Leverage equals Financial Gravity. No matter how advanced our financial engineering or how stable our institutions appear, highly leveraged economies can operate on the brink of crisis for years. They might seem safe until a sudden loss of confidence triggers a catastrophic collapse.
We are not immune. The 1920s global boom, where people believed World War I would never happen again, ended with the Great Depression. The 2008 subprime crisis proved that even a fully integrated global economy with sophisticated tools was not safe from the same forces that destroyed the past. The lesson is clear: when you combine human overconfidence with high debt levels, the result is always the same. Gravity always wins.

Look at this chart: "The Anatomy of an Excuse: 80 Years of Delusion." It maps out a terrifying pattern that has played out across four decades. In the 1920s, optimism about post-war stability led to the Great Depression. In the 1980s, the belief that commodity prices and bank loans were safe triggered a global debt crisis. The 1990s saw a false sense of security based on fiscal discipline, only to collapse into the Asian Financial Crisis. And finally, the 2000s convinced us that advanced financial engineering had permanently dispersed risk, resulting in the 2008 Global Second Great Contraction.
Every single era followed the same script. First, there was a catalyst—whether it was wartime optimism, petrodollar recycling, or subprime borrowing. Then, the excuse kicked in: people insisted that "this time is different." They argued that history had changed, that new tools made us safer, or that global integration eliminated risk. But as the chart proves, every excuse was a delusion. The result? A predictable collapse. From the 1929 defaults to the 2008 contraction, the lesson remains unchanged: whenever we believe we have outsmarted the past, we are usually just setting the stage for the next disaster.

The screen in front of us tells a stark story about the fragility of our global financial system. Look at the timeline stretching back 800 years across 66 countries. It reveals one inevitable pattern: no matter how long we think we've survived, the cycle of crisis always returns.
The slide highlights a critical flaw in how we measure risk. If you only look at a 25-year window, you have almost zero chance—just a 1-in-4 odds—of spotting a "100-year flood." But when we pull back and view history through an 8-century lens, the visibility of disaster becomes eight times clearer. We aren't seeing random glitches; we are seeing a repeating rhythm.
This historical data exposes the dangerous myth of "this time is different." For centuries, nations have believed they were smarter than the past, that their advanced institutions or unique circumstances made them immune. Yet, as the graph shows, from the 12th century to 2008, the pattern holds firm. Whether it was ancient European monarchs or modern emerging markets, the result is the same: when debt accumulates beyond a certain threshold, confidence collapses, and the inevitable crash arrives. The lesson is simple but hard to hear: history doesn't repeat itself exactly, but it often rhymes, and ignoring that rhyme is the surest way to get hurt.

The Hall of Mirrors: The Original Serial Defaulters. Look at this map. It's not just a geography lesson; it's a history of financial failure. We are looking at the original serial defaulters—countries that thought they were different, only to repeat the same mistakes over centuries.
Take Spain, highlighted here as the ultimate serial defaulter with 13 defaults. They squandered New World silver on imperial hubris, defaulting 6 times before 1800 and 7 more in the 19th century. Then look at France, with 8 defaults. It was a continuous cycle of repudiation during its emergence as a nation-state, where kings would even execute creditors to solve debt problems. In stark contrast, the UK had only 1 major default—Edward III's 1340 default to Florentine bankers, which triggered an early contagion collapse. But even the UK wasn't perfect until the Glorious Revolution of 1688 finally stabilized their system.
The key takeaway at the bottom is this: 'Emerging market' is a temporary phase. Today's most stable financial capitals spent centuries acting exactly like today's riskiest emerging markets. They all ran the same script. This is the "This Time Is Different" syndrome. Every crisis is preceded by the belief that the old rules are dead and we are smarter now. But history shows that the debt thresholds for emerging markets are far lower than we think. Many countries defaulted with debt-to-GDP ratios well below the 60% safety margin we see today. The lesson is clear: if you ignore the historical patterns of serial default, you are setting yourself up for the next crash.

The Ledger of Folly isn't just a title; it's a map of the four deadly traps that have doomed economies for centuries. Look at the screen: Sovereign External Debt, Banking Crises, Domestic Debt, and Inflation. These aren't isolated events; they are interconnected nodes in a system where one failure often triggers the others.
Let's break down what makes each of these so dangerous. Start with Sovereign External Debt. This is the high-visibility crisis where a nation defaults on foreign creditors. It's characterized by international standoffs and capital flight. It's the classic image of a country falling out of favor with the world. But there's another, often invisible killer: Domestic Debt. This is the "hidden" crisis. It involves defaults to a nation's own citizens, usually executed quietly without the international media attention that external debt gets. Because it's domestic, governments can sometimes use stealth tactics, like high inflation, to dilute the value of the debt they owe their own people, effectively defaulting without technically admitting it.
Then we have Banking Crises. The slide calls them the "equal-opportunity destroyer." Whether it's a rich nation or a developing one, panics and bank runs paralyze the system with identical severity. When confidence evaporates, liquidity dries up, and the entire economy can freeze. Finally, there's Inflation & Currency Crashes. This is described as a "default by stealth." Think of it as the modern equivalent of monarchs shaving silver off coins to pay debts. When inflation hits thresholds like 40% post-WWII or 20% pre-WWI, the currency collapses, wiping out savings and destroying economic stability.
The core message here is simple yet terrifying: these mechanisms have worked for centuries. From the silver debasement of ancient kings to the modern subprime mortgage meltdown, the tools of financial destruction remain remarkably consistent. Understanding these four pillars is the first step to realizing that "this time is different" is not a prediction—it's a historical illusion.

Debt Intolerance: The Invisible Ceiling. Imagine a pressure gauge designed to measure a nation's financial health, where the needle isn't just pointing to a number, but to a point of no return. Today's slide visualizes this critical concept: the threshold where debt stops being a manageable tool and becomes an existential threat.
Look at the scale. It measures Debt-to-GNP, ranging from 0% to 100%. But here is the shocking reality: for many emerging markets, the "safe" zone is incredibly narrow. The data shows that over 50% of emerging market defaults happen when debt is still below 60% of GNP. In fact, a staggering 20% of defaults occur when debt levels are below 40%. This contradicts the common belief that 60% is the universal safety limit, a benchmark often borrowed from the European Union's Maastricht Treaty.
Unlike advanced economies like Japan, which can comfortably carry debt levels of 170% without collapsing, countries with a history of default face a brutal 'debt intolerance.' Their borrowing limits are much lower. Once their debt-to-GNP ratio crosses a critical threshold—often somewhere between 30% and 35%—market confidence evaporates instantly. Investors lose faith, interest rates spike, and the country is trapped in a vicious cycle of repayment difficulties. They lose the ability to borrow even at levels that seem entirely manageable to outsiders. This invisible ceiling is why many nations fail not because they borrowed too much in absolute terms, but because their history and institutions made them intolerant of debt long before the math suggested they should have fallen.

The Anatomy of a Shock: Solvency vs. Liquidity. Look at this cycle. It starts with the Illusion of Solvency. Governments borrow short-term just to enjoy those low interest rates, convinced that their fundamentals are mathematically manageable. But then, Step 2 hits: The Shock. A sudden shift in the political climate, a spike in global commodity prices, or a neighbor defaulting shakes lender faith instantly. This is where the real danger lies. Remember this core distinction: Solvency is math, but Liquidity is psychology. When confidence evaporates, the difference between the two disappears. Suddenly, you're in Step 3, The Liquidity Trap. Creditors refuse to roll over short-term debt, and the market confidence line shatters. The result? Step 4: Multiple Equilibria. The country is forced into an immediate liquidity crisis, transforming what looked like a manageable balance sheet into a full sovereign default. It's a terrifying reminder that even if you can pay your bills on paper, if the market stops trusting you, you're already bankrupt.
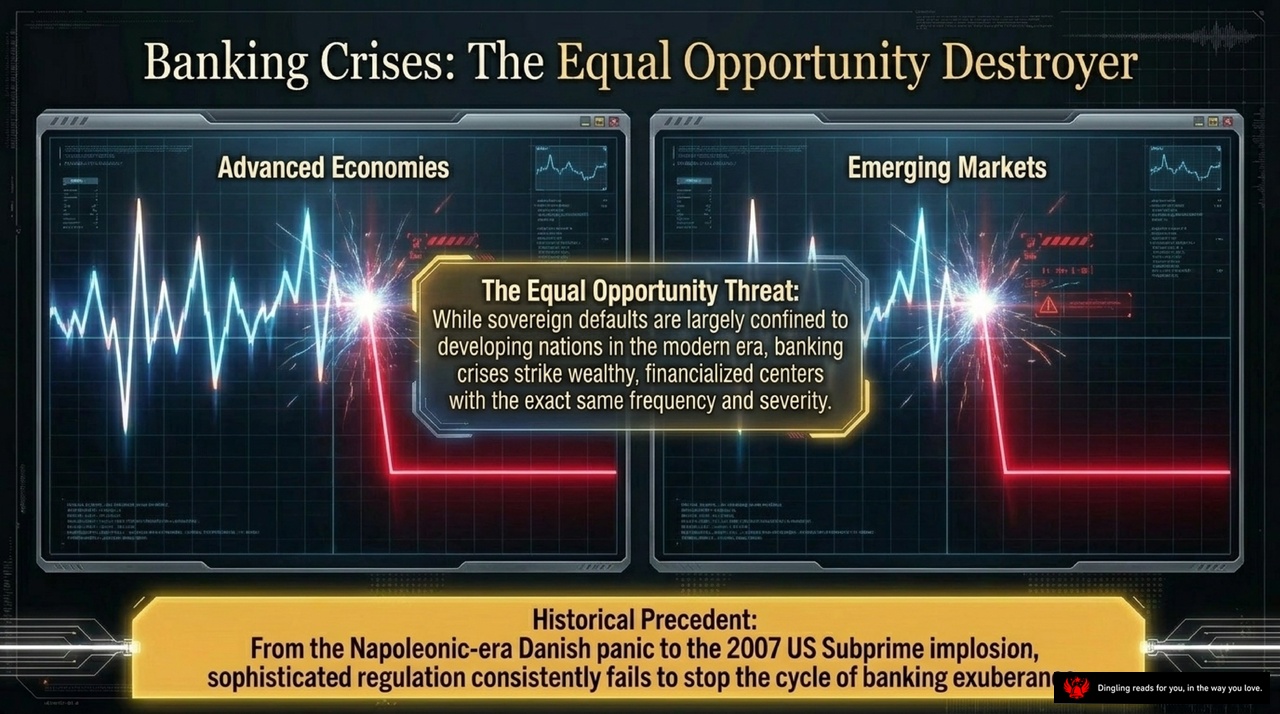
Look at this graph. It illustrates a harsh but undeniable reality: banking crises are the great equalizers of destruction. The visual clearly splits the world into "Advanced Economies" and "Emerging Markets," yet the outcome is identical. Both sides show that same sharp, catastrophic drop—a crash that wipes out gains just as quickly.
The central message here is the "Equal Opportunity Threat." As the slide highlights, while sovereign defaults are often confined to developing nations in the modern era, banking crises strike wealthy, financialized centers with the exact same frequency and severity. It doesn't matter if you are rich or poor; if your financial system gets overheated, the crash is coming.
History proves this point repeatedly. From the Napoleonic-era Danish panic to the 2007 US Subprime implosion, sophisticated regulation has consistently failed to stop the cycle of banking exuberance. Every time we think we've learned the lessons, or that "this time is different," we just set the stage for the next crash. The data shows that once the bubble bursts, the recovery is slow and painful for everyone, regardless of where you are on the globe.
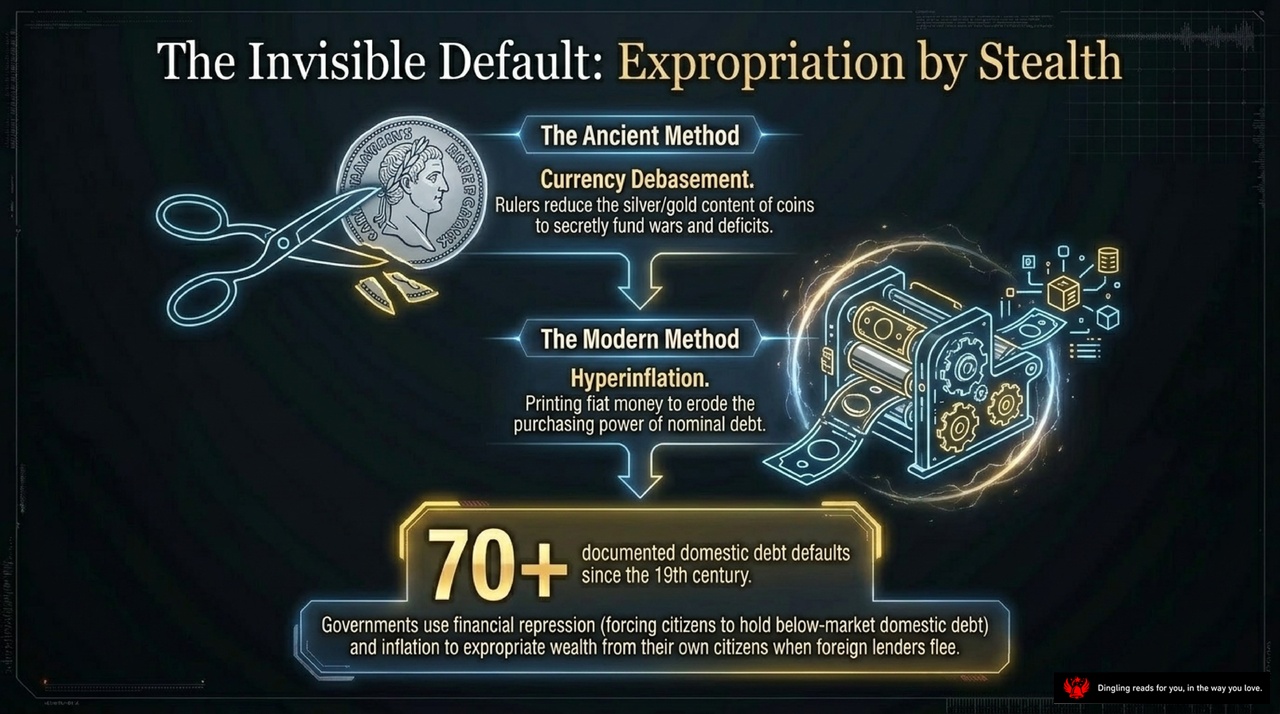
The Invisible Default: Expropriation by Stealth. Look at this slide. It reveals a dark truth that history repeats: governments don't always default on their debts by saying "no." Instead, they steal from their own citizens by stealth.
The infographic contrasts two methods. On the left, "The Ancient Method" shows currency debasement. Rulers would secretly cut the silver or gold content of coins—like the coin being sliced by scissors—to fund wars and deficits without admitting it. On the right, "The Modern Method" illustrates hyperinflation. Instead of melting down coins, governments simply print fiat money. This erodes the purchasing power of nominal debt, effectively stealing value from everyone holding that currency.
The bottom section highlights the scale of this issue: over 70 documented domestic debt defaults since the 19th century. The text explains that when foreign lenders flee, governments use financial repression and inflation to expropriate wealth from their own people. They force citizens to hold below-market debt while inflating prices, quietly transferring wealth from the public to the state. This isn't a theoretical risk; it's a recurring historical pattern where the state becomes the ultimate creditor, funded by the very citizens it owes.

Look at this screen. We're looking at the 2007 US Subprime Crisis, often called the "Second Great Contraction." But here's the hard truth: this wasn't a surprise. It was a textbook collapse that everyone saw coming, yet no one acted.
The image highlights four massive warning signs that policymakers completely ignored. First, asset price inflation—housing prices had doubled. Second, rising household leverage, meaning families were drowning in debt. Third, massive current account deficits as the US borrowed heavily from abroad. And fourth, slowing growth trajectories.
Despite these red flags, decision-makers dismissed them. Why? They fell into the trap of thinking "This Time Is Different." They pointed to globalization, the new power of securitization, and "better" monetary policy as reasons why a crash was impossible. They believed old rules no longer applied.
But history doesn't care about our optimism. The signs were right there in the data, screaming for attention. The crisis eventually arrived with full force, proving that ignoring macroeconomic warnings is the fastest way to trigger a disaster.
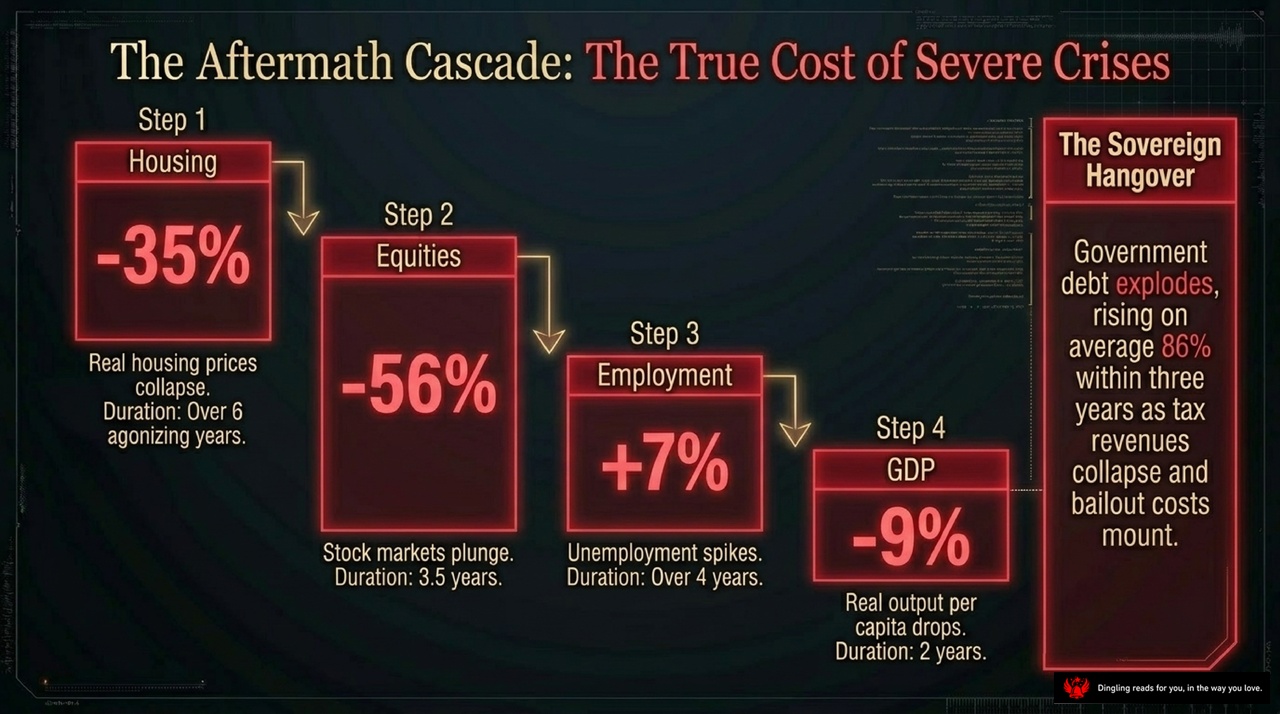
The Aftermath Cascade: The True Cost of Severe Crises isn't just about the crash itself—it's about the domino effect that follows. When a severe crisis hits, the pain doesn't stop at the stock market. It ripples through every corner of the economy.
First, the housing market takes the hardest hit. Real housing prices collapse by an average of 35%, dragging on for over six agonizing years. This isn't a quick dip; it's a long, painful depression for homeowners.
That housing crash triggers the next domino: Equities. Stock markets plunge an average of 56%, and this correction lasts about 3.5 years. As wealth evaporates from portfolios, confidence crumbles.
Then comes the human cost. Unemployment spikes by 7%, and this high joblessness persists for over four years. Families lose their income, spending power, and stability.
Finally, the entire economy contracts. Real output per capita drops by 9%, a decline that lasts for two years. The result? A sovereign hangover. As the economy shrinks and tax revenues collapse, governments are forced to mount massive bailouts. Consequently, government debt explodes, rising on average 86% within just three years.
The lesson is clear: severe crises don't just break the market; they break the entire social and economic fabric, leaving a scar that takes years to heal.

The graph on your screen reveals a terrifying truth about the global economy: success is often the greatest risk. We are looking at the "Sovereign Trap," where nations climb from the Default Zone into the Safe Zone, only to find that this very success sets them up for a catastrophic fall.
Notice the jagged line climbing over the decades. The chart highlights a critical concept: "Graduating from serial default requires decades, sometimes centuries, of perfect repayment and low debt." This is the hard work of rebuilding trust. But look at the red spike around 2000. That represents the moment many nations thought they had finally made it.
The "Warning Label" on the right is a stark reminder of what happens next. It points to "spectacular defaults" like Argentina in 2001. These crises didn't happen because countries were broke; they happened right after "sovereign upgrades and global praise." When a country gets a clean bill of health from the world, capital markets integrate, and confidence soars. But the chart makes it clear: this integration does not cure deep institutional weaknesses. Instead, it only raises the stakes of the gamble.
The lesson here is brutal but necessary. Moving from the Transition Zone to the Safe Zone doesn't mean you're safe forever. It just means you've raised the stakes on a game you might not know how to play. When confidence finally cracks, the fall from that high peak is far more devastating than a slow decline from the bottom. History shows us that the danger isn't being in the red zone; it's believing you've finally escaped it.
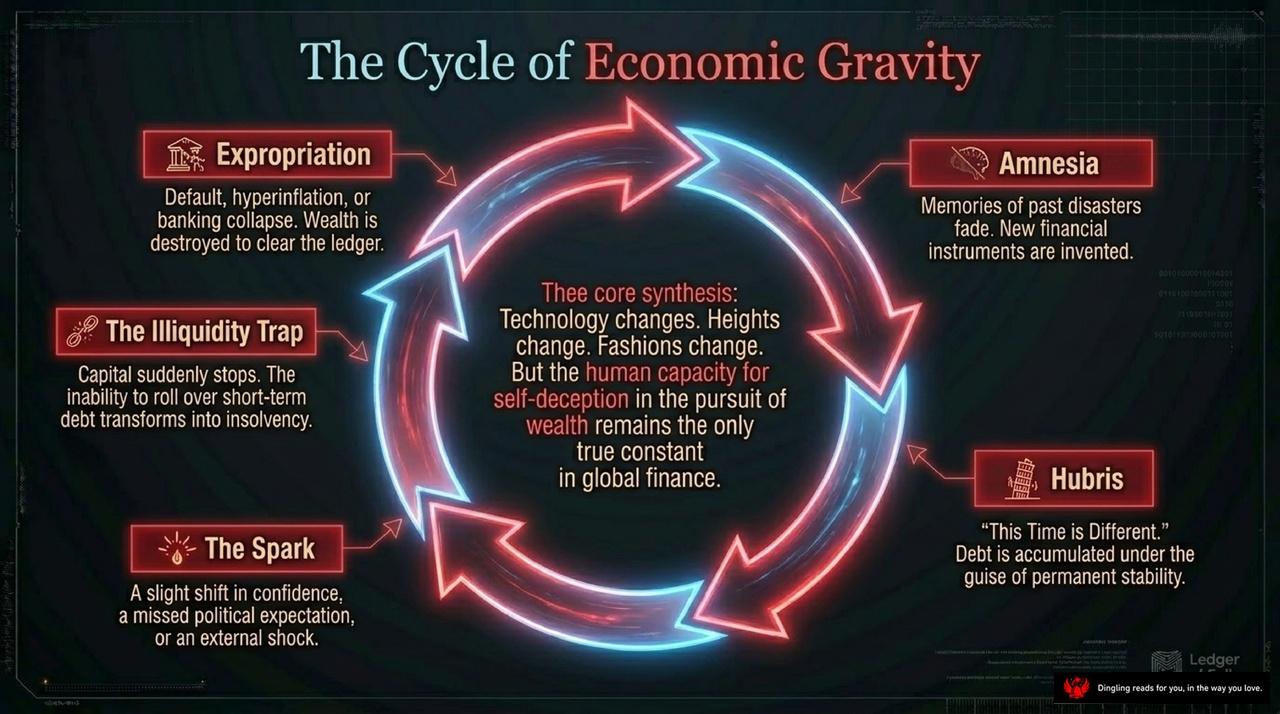
The Cycle of Economic Gravity isn't just a catchy title; it's the brutal reality of how global finance actually works. Look at this diagram: it shows a relentless loop where technology and fashion change, but one human trait remains the true constant: our capacity for self-deception in the pursuit of wealth. This is the engine of the cycle.
It starts with **Hubris**. We see the iconic phrase "This Time is Different." Believers think debt can be accumulated forever under the guise of permanent stability, convinced that this time, the rules have changed. But inevitably, a slight shift in confidence or an external shock triggers **The Spark**. Suddenly, capital stops flowing. The inability to roll over short-term debt transforms instantly into insolvency.
When the money vanishes, we hit **The Illiquidity Trap**. Wealth is no longer just gone; it is actively destroyed. This leads to **Expropriation**—whether through default, hyperinflation, or banking collapse. The goal is clear: clear the ledger. Finally, in the aftermath, we get **Amnesia**. Memories of past disasters fade. New financial instruments are invented, and the cycle begins all over again. History doesn't repeat, but it often rhymes because we keep forgetting the lesson.

History has a cruel way of repeating itself, and for the last eight centuries, across sixty-six nations, every single catastrophic financial collapse has been preceded by the exact same illusion: the arrogant belief that we have outsmarted the cyclical laws of economic gravity. It is the "this time is different" syndrome—the confident assumption that our era is unique, that we have learned from the past, and that old valuation rules are simply obsolete.
But the data proves conclusively that leverage combined with human amnesia will inevitably yield disaster, regardless of how sophisticated our financial tools or institutions become. If eight hundred years of history prove that the smartest minds in finance are consistently blinded by the illusion of their own exceptionalism, we must ask ourselves a difficult question: what systemic blind spots are you justifying in your ledgers today? The truth is, no amount of innovation can break the cycle of debt and crisis unless we finally stop believing that we are immune to it.