
Trading for a Living: Complete Chapter-by-Chapter Summary

Welcome to "Trading for a Living," Dr. Alexander Elder's definitive guide to mastering the financial markets. Today, we're tackling the most critical truth in trading: success isn't about beating the market; it's about replacing emotional gambling with the clinical discipline of mind, method, and money.
Most beginners are lured in by the promise of easy riches or the thrill of an intellectual challenge, but they quickly fall into traps. Many lose everything because they confuse luck with skill, while others become self-destructive, pouring their inner conflicts into the market. The real secret lies in treating trading like a profession, not a casino. As Dr. Elder reminds us, you must shift your focus from chasing quick profits to building a robust system based on three pillars: a healthy mindset, a logical trading strategy, and strict money management. Think of these as the three legs of a stool; if even one is weak, the whole structure collapses.
The market is a high-stakes game where emotions like fear and greed are your biggest enemies. Unlike other careers, there is no safety net when you lose, and the market doesn't care about your personal story. To survive, you must accept that you cannot control the market, only your own behavior. By adopting the principles of self-control and rigorous planning, you can transform from a victim of the market into a disciplined, long-term winner.
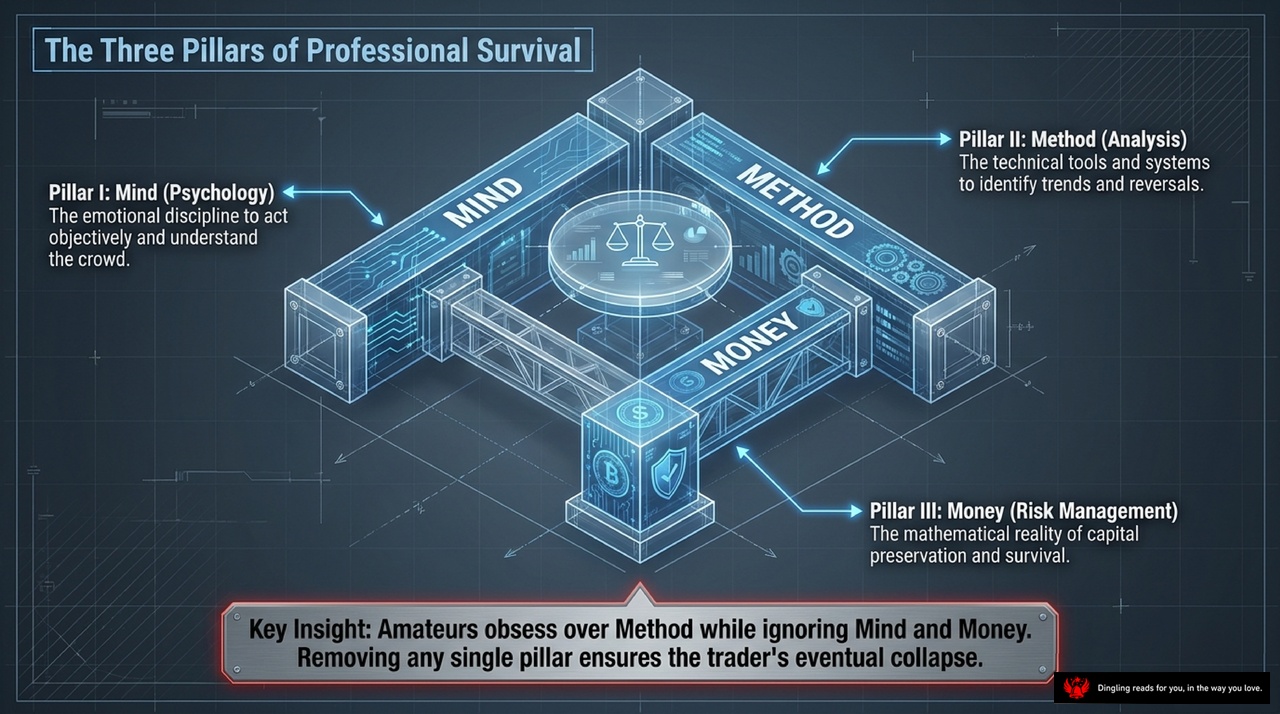
Welcome to the blueprint of professional survival. If you look at this diagram, you'll see three massive pillars holding up a trader's career: Mind, Method, and Money. Think of them as the three legs of a stool; if you remove just one, the whole structure collapses.
Let's break this down. The first pillar is Mind, which is all about Psychology. It's the emotional discipline required to act objectively and truly understand the crowd. Without this, even the best strategy fails because fear and greed will take the wheel. The second pillar is Method, or Analysis. This is your technical toolkit—the systems and tools you use to identify trends and reversals with logic, not hope. The third pillar is Money, which stands for Risk Management. This is the mathematical reality of capital preservation. It ensures that you can stay in the game long enough to let your skills pay off.
Here is the hard truth that separates amateurs from professionals: most beginners obsess over Method. They buy expensive software, chase the latest indicators, and think a magic formula will make them rich. They ignore Mind and Money entirely. They don't manage their emotions, and they risk too much capital on every trade. This is a recipe for disaster. As the graphic warns, removing any single pillar ensures your eventual collapse. To survive in this market, you must master all three simultaneously.
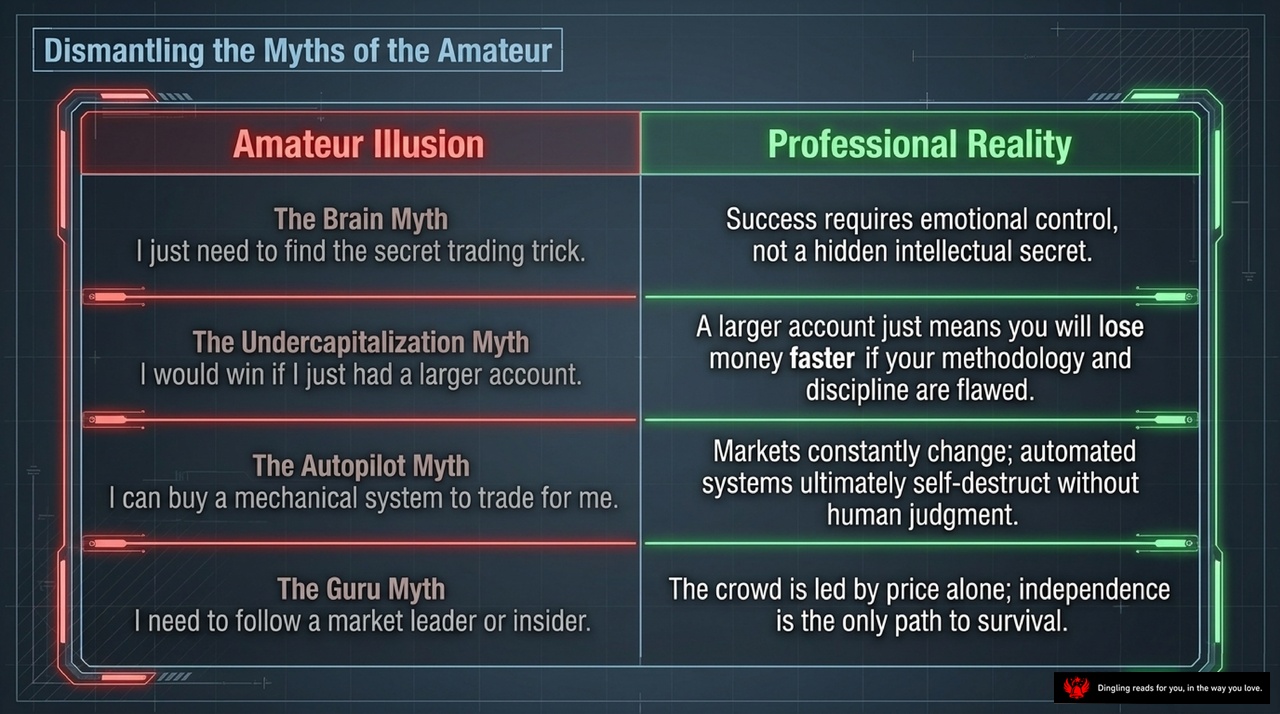
Welcome back. Today, we're diving deep into the mechanics of how price actually moves, moving past the myths of "insider secrets" to understand the true battlefield.
In the market, you aren't fighting numbers on a screen; you are fighting a crowd of people. Every price is simply the consensus of buyers, sellers, and watchers trying to outguess each other. Think of the market as a giant game of tug-of-war. When the crowd gets greedy, they buy at higher prices, pushing the price up. When they get fearful, they sell, dragging it down. This is why technical analysis is so powerful—it's essentially a real-time poll of the crowd's mood.
But here is the hard truth: you cannot predict the future. Professional traders don't try to guess what happens next; they simply react to what is happening right now. Imagine an emergency room doctor. They don't panic about whether a patient will survive tomorrow; they focus entirely on stopping the bleeding and treating the wound in front of them. Your job is the same. Ignore the crystal balls and the "gurus" promising you 100x returns. Instead, focus on three pillars: analyze the balance of power between buyers and sellers, manage your money strictly, and stick to your plan like it's your life.
To see who is winning this tug-of-war, we look at specific tools. Trend-following indicators, like moving averages, tell us the direction of the fight. Oscillators, like the RSI or Stochastic, help us spot when the crowd has gotten too excited or too scared, signaling a potential reversal. But the most powerful tool is often volume. Volume is the fuel of the market. If the price is rising but volume is drying up, it's a bearish divergence—a sign that the buyers are running out of steam. Conversely, if you see massive volume during a drop, it often means panic selling has hit bottom, and a rebound is coming.
We also look at market breadth. Are the leaders of the market rising, or are the leaders falling? If the top stocks are making new highs while the overall index stalls, that's a warning sign. We use indicators like the New Highs-New Lows index and the TRIN to measure this sentiment. When the TRIN gets too high, it means everyone is buying, and the party is about to end. When it gets too low, everyone is selling, and the bottom is likely near.
Finally, we must respect the time dimension. Markets move in cycles. By looking at multiple timeframes—like checking the weekly chart before making a daily trade—we can filter out the noise and see the true trend. This is the essence of the "Triple Filter" approach: check the long-term trend, find the medium-term entry signal, and then execute at the precise moment.
Remember, the market is indifferent to you. It doesn't care about your dreams or your fears. It only responds to the collective psychology of millions of participants. Your edge comes not from predicting the future, but from understanding the present, controlling your emotions, and having the discipline to act when the crowd is wrong. Stay independent, stay rational, and let the data guide your decisions.
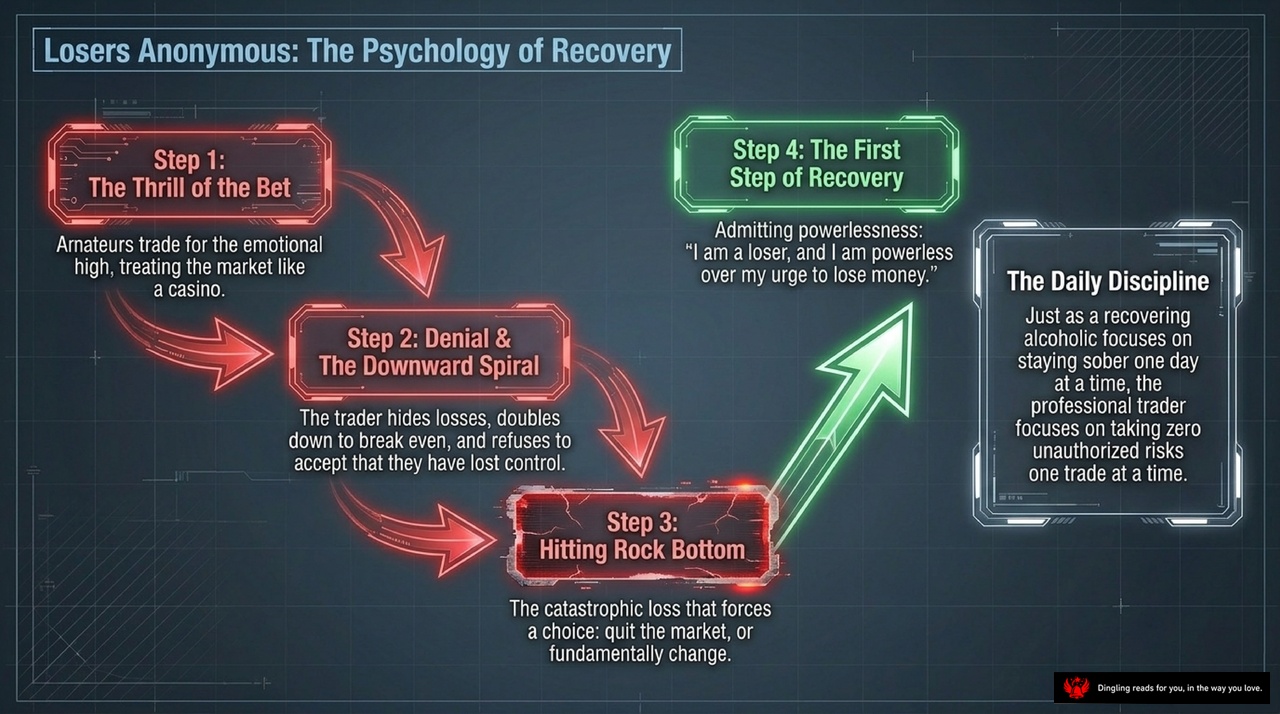
The chart you see here maps out the exact psychological trap that destroys most traders, a cycle so familiar it's practically a disease. It starts with **Step 1: The Thrill of the Bet**, where amateurs treat the market like a casino, chasing that emotional high instead of logic. This inevitably leads to **Step 2: Denial & The Downward Spiral**. Here, the trader hides losses, doubles down just to break even, and refuses to accept that they've lost control. That denial pushes them right into **Step 3: Hitting Rock Bottom**, a catastrophic loss that forces a brutal choice: quit the market or fundamentally change.
But there is a way out, shown in **Step 4: The First Step of Recovery**. It all comes down to admitting powerlessness. You have to say, "I am a loser, and I am powerless over my urge to lose money." This is where the analogy from the "Losers Anonymous" program becomes critical. Just as a recovering alcoholic focuses on staying sober one day at a time, a professional trader must focus on taking zero unauthorized risks one trade at a time. This **Daily Discipline** is the antidote to the spiral. By treating every single trade as a standalone event and refusing to gamble on the next one to fix the last, you break the cycle. You stop hiding losses and start managing them, transforming from a gambler into a disciplined operator who respects the rules of the game.

Imagine the market as a vast, invisible arena where every price tick is actually a handshake between a buyer and a seller, surrounded by a nervous crowd watching closely. This isn't just about reading lines on a screen; it's about trading human behavior itself. At the center of this action is "Price," which acts as a momentary psychological consensus.
On one side, you have "The Bulls," driven by greed. These are the buyers who bid prices up, betting that the market will continue to rise. On the opposite side are "The Bears," fueled by fear. These are the sellers pushing prices down, convinced the market will fall. But here is the critical piece often missed by beginners: there is a third force, "The Undecided." This is the watching crowd whose potential entry creates a sense of urgency, forcing the bulls and bears to act. It is this pressure from the undecided that often triggers the final move.
Every time you see a chart move, remember that you are not analyzing cold numbers. You are witnessing a battle of emotions—greed versus fear—amplified by the anxiety of those waiting to join in. Professional traders know that the most powerful signal isn't a complex indicator, but understanding who is in control at that exact moment: the greedy buyers, the fearful sellers, or the impatient crowd waiting for permission to enter.
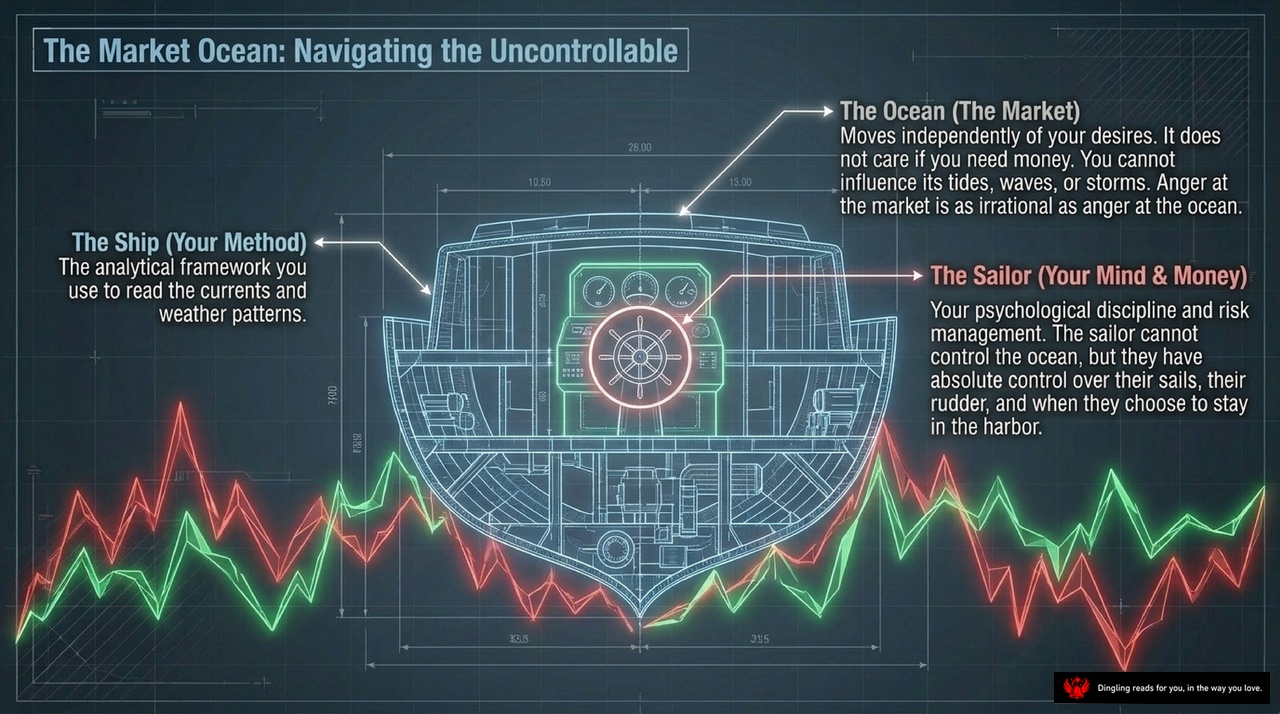
Imagine the market as a vast, unpredictable ocean. Just as the sea moves independently of a sailor's desires, ignoring their need for money or safety, the market operates on its own tides, waves, and storms. Anger at the market is as irrational as blaming the ocean for not delivering a specific wave. While you cannot control the ocean, you do have absolute command over your own ship. Your "ship" is your analytical framework—the method you use to read the currents and weather patterns.
Inside your ship sits the sailor: you, your mind, and your money. Your role isn't to force the ocean to behave, but to exercise psychological discipline and manage risk. You have full control over your sails, your rudder, and the critical decision of when to stay in the harbor. The chart behind us shows the volatile red and green lines of market data crashing against the hull, representing the uncontrollable forces. But remember, the difference between a shipwreck and a successful voyage comes down to your ability to navigate these forces rather than fight them.
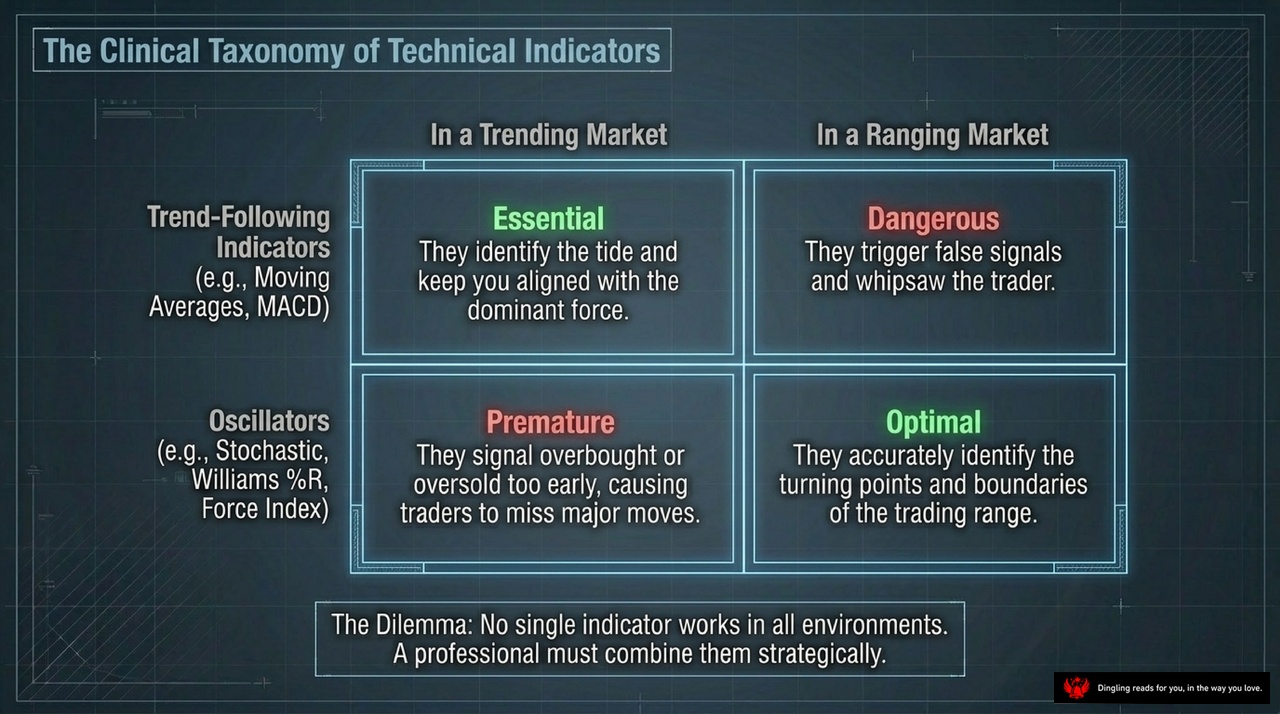
Imagine your trading chart as an X-ray machine, stripping away the noise to reveal exactly who holds the power right now. This is the core idea behind the "Perspective Indicator," a powerful tool invented by Alexander Elder. Unlike traditional indicators that chase price, Perspective looks at the raw strength of bulls and bears by comparing the day's high and low against the average value. It splits the screen into three zones: the top tracks price and a 13-day EMA, the middle measures bullish power, and the bottom measures bearish power. If the bullish power turns negative, it means the bears have completely crushed the bulls. If the bearish power flips positive, the bulls have won decisively.
The real magic happens when you combine this with the concept of "momentum" or strength. Elder's second tool, the Momentum Index, fuses price direction, magnitude, and volume into one signal. It asks a simple question: Is the price move supported by the volume behind it? If price climbs but volume fades, the trend is likely dying. If price drops on heavy volume, the sell-off has real teeth. By smoothing this data with moving averages, you get a clear picture of whether the market's energy is surging or collapsing.
The golden rule here is simple: never fight the dominant force. Use Perspective to identify who is in charge, then align your trades with that direction. Look for the strongest signals when price breaks a low but bearish power fails to follow—a classic bullish divergence—or when price hits a new high but bullish power stalls. Remember, successful trading isn't about predicting the future; it's about seeing the present clearly and acting with the market, not against it.
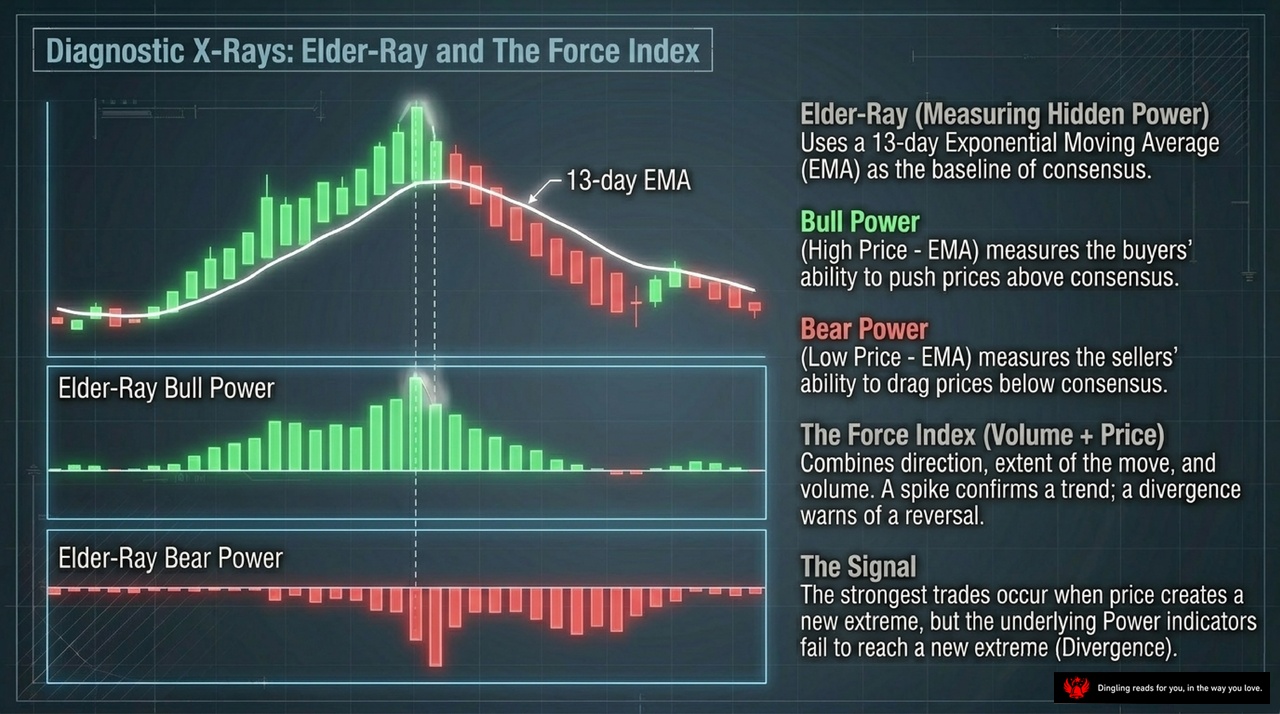
Imagine the market as a complex X-ray machine, stripping away the noise to reveal the true power dynamics beneath the price action. This is the essence of the diagnostic tools we are discussing today: the Elder-Ray and the Force Index.
First, let's look at the Elder-Ray, which measures hidden power by using a 13-day Exponential Moving Average as our baseline of consensus. Think of this line as the battlefield's center. Above it, we calculate Bull Power by taking the high price minus the EMA; this tells us exactly how strong the buyers are at pushing prices above the consensus. Below the line, Bear Power is the difference between the low price and the EMA, measuring the sellers' ability to drag prices down. In the chart, you see these forces visualized as green and red bars, showing the intensity of each side's push.
But price alone can be deceiving. That is where the Force Index comes in. It combines direction, the extent of the move, and volume into one powerful metric. A spike in the Force Index confirms that a trend has real fuel behind it, while a divergence warns us that the trend is running out of steam. The strongest trades occur not when price makes a new extreme, but when the underlying Power indicators fail to follow suit. This divergence is your golden signal, telling you when the market is about to turn. By watching these diagnostic rays, you stop guessing and start seeing the true balance of power playing out in real-time.
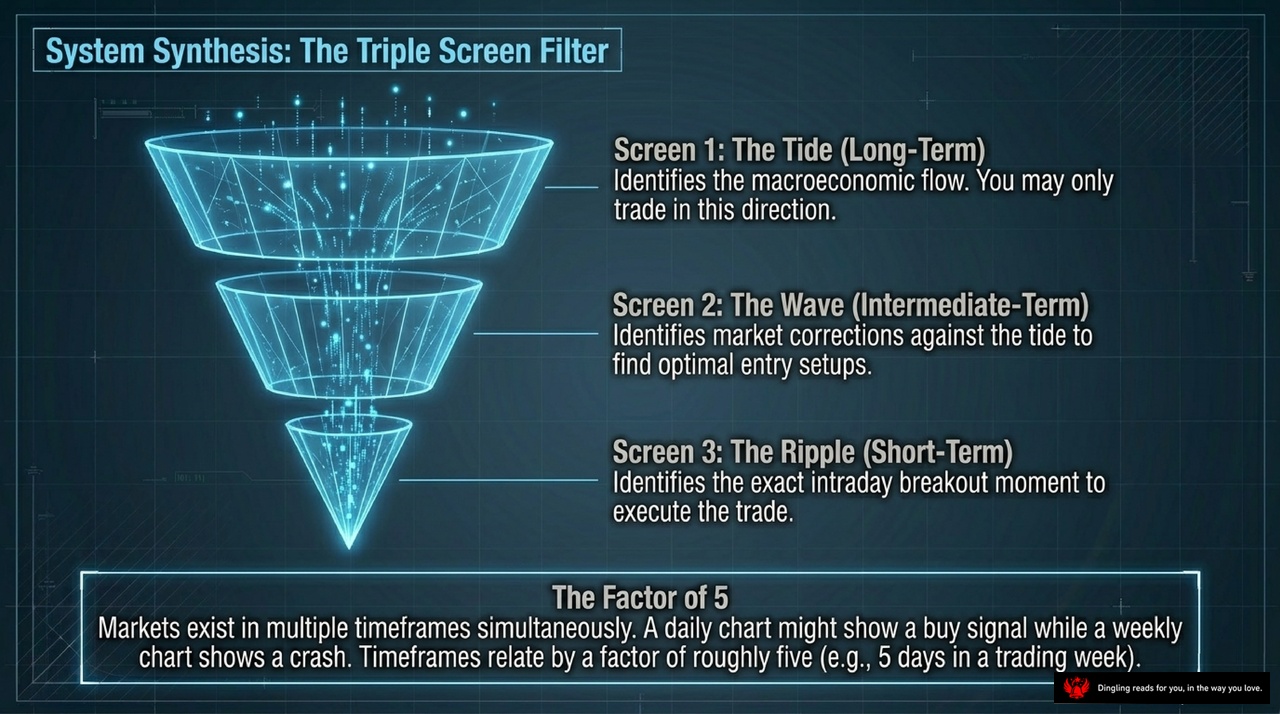
Let's dive into the mechanics of how we actually execute trades using the "Triple Screen Filter" system. As you can see on the slide, we aren't just looking at one chart; we are synthesizing the market across three distinct timeframes to filter out the noise and find high-probability setups.
First, we look at Screen 1, The Tide. This is our long-term filter, usually on a weekly chart. It identifies the macroeconomic flow. The golden rule here is simple: you may only trade in this direction. If the Tide is up, you are looking for buys; if it's down, you are looking for sells. This screen keeps us from fighting the major trend.
Next, we move down to Screen 2, The Wave. This is our intermediate-term filter, typically on a daily chart. Here, we are looking for market corrections against the Tide to find optimal entry setups. For example, if the long-term Tide is bullish, we wait for the daily chart to pull back and show a sign of strength, like a bullish divergence or a break of a trendline. This screen helps us time our entry so we are buying the dip, not chasing the top.
Finally, we zoom in to Screen 3, The Ripple. This is our short-term filter, often on an hourly or intraday chart. It identifies the exact intraday breakout moment to execute the trade. This is where we place our stop-loss orders and enter the market with precision.
Underpinning all three of these screens is "The Factor of 5." Markets exist in multiple timeframes simultaneously, and they relate to each other by a factor of roughly five. Think of it this way: five days make a trading week, five weeks make a month, and five months make roughly a quarter. So, if you are trading on a daily chart, your long-term context is the weekly chart, and your short-term trigger is the hourly chart. A daily chart might show a buy signal while a weekly chart shows a crash; that contradiction tells you to stay out. By aligning all three screens, we ensure that our short-term trade is supported by a strong intermediate trend, which is ultimately riding the wave of a favorable long-term tide. This multi-layered approach is what separates the amateurs who gamble on a single chart from the professionals who engineer their edge.
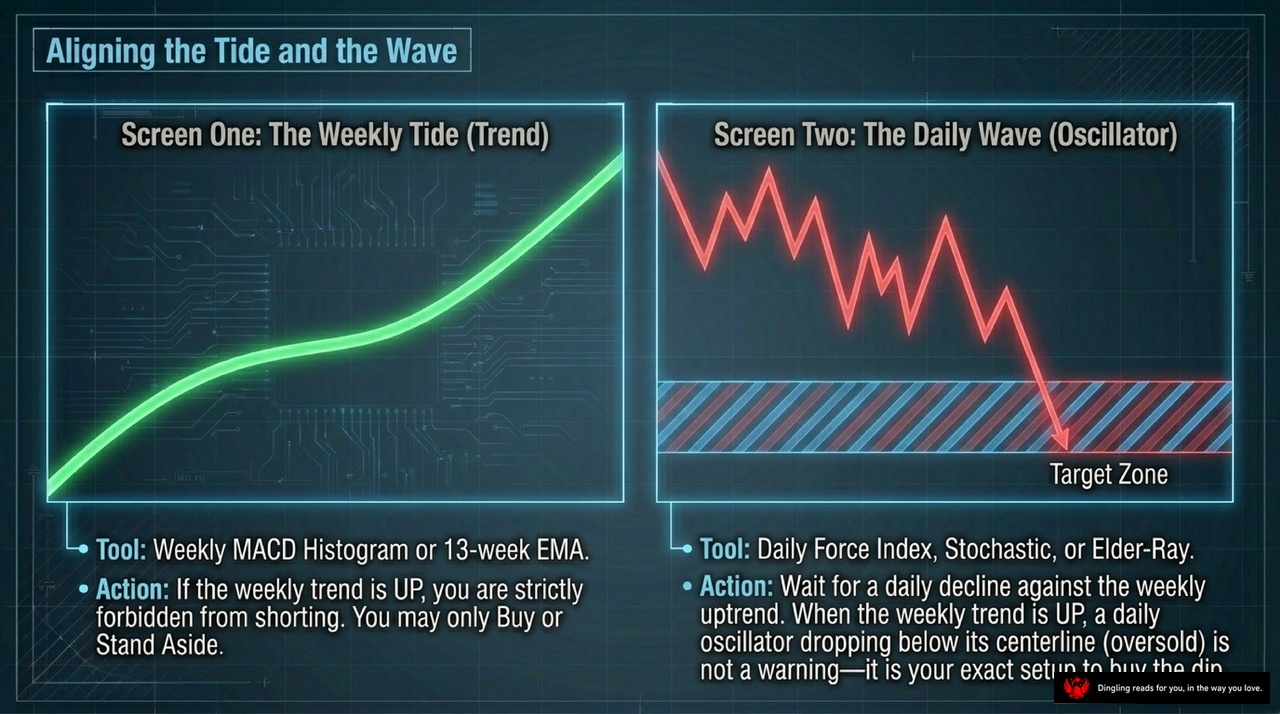
Success in trading isn't about predicting the future or chasing every move; it's about mastering the art of alignment. Look at the screen before us: we are aligning the "Tide" with the "Wave." Think of the market like the ocean. You cannot stop the tide, just as you cannot stop the market's long-term trend. If the weekly tide is rising, you are strictly forbidden from shorting. That is your first rule of survival. You may only buy or stand aside. This is where the Weekly MACD Histogram or a 13-week EMA becomes your compass, ensuring you are sailing with the current, not against it.
But once you've aligned with the tide, you need to catch the daily wave. This is where the oscillator comes in. Even in a strong uptrend, the market will pull back. Instead of fearing this drop, a professional sees it as an opportunity. When the weekly trend is up, a daily oscillator dropping below its centerline isn't a warning of disaster; it is your exact setup to buy the dip. We use tools like the Daily Force Index, Stochastic, or Elder-Ray to spot these moments. The key is patience. Wait for a daily decline against the weekly uptrend, and then strike. By aligning the long-term trend with the short-term pullback, you stop gambling and start executing a precise strategy that turns market volatility into your greatest ally.

So, we've just walked through the heavy machinery of technical analysis—looking at candlesticks, volume, and those complex indicators like the MACD or RSI. It's easy to get lost in the data, thinking that if you just find the perfect formula, you can predict the future. But here is the hard truth: you cannot predict the market. You can only react to it.
Think of yourself as a doctor in an emergency room. When a patient walks in bleeding, do you stop to guess if they will survive the night? No. You stop the bleeding, you stabilize them, and you treat the wound you can see right in front of you. That is exactly how professional trading works. You don't try to be a fortune teller guessing tomorrow's price; you are a technician managing the market's current reality.
The most powerful tool in your arsenal isn't a crystal ball; it's the concept of "Price Action." This is the idea that the current price is the only thing that matters because it represents the ultimate consensus of all buyers and sellers right now. If you see a trend forming, you don't argue with it or try to top it. You simply align yourself with the direction the market is already moving.
But knowing the direction is only half the battle. How do you actually enter the trade safely? This is where your discipline comes in. Instead of chasing the market at the current price, which often traps you in a bad spot, you use a "Trailing Buy Stop." Imagine placing an order one tick above the previous day's high. You are essentially saying, "I will only join this trade if the market proves it is strong enough to break through." If the market keeps falling, your order never gets filled, and you stay out. If it surges upward, you are pulled in exactly when the momentum confirms the trend.
This approach solves a massive problem: it removes emotion from the equation. You aren't guessing; you are waiting for the market to give you a clear signal. You only enter when the short-term momentum aligns with the long-term trend. It's like waiting for the green light before stepping off the curb. By sticking to this logic, you avoid the trap of trying to catch a falling knife or buying at the top of a spike. You wait for the setup to be complete, you execute with precision, and you let the market do the work.
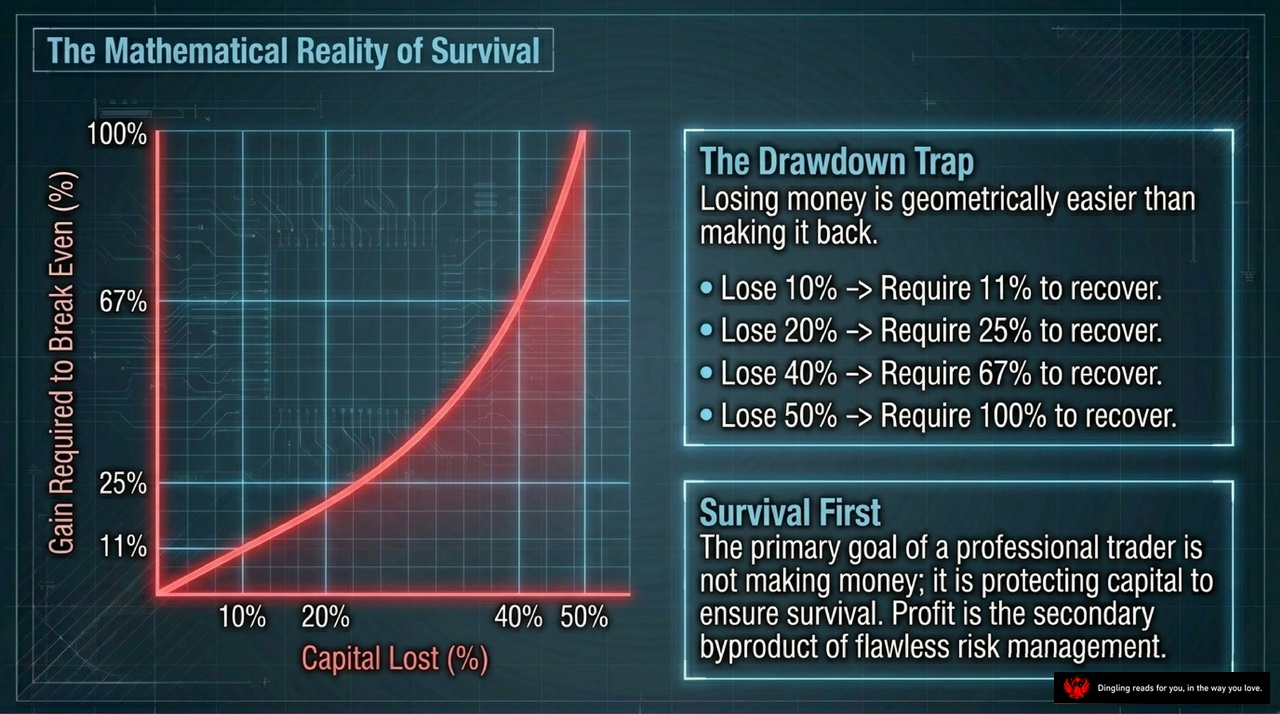
Look at this graph titled "The Mathematical Reality of Survival." It illustrates a brutal truth that almost every trader ignores: losing money is geometrically easier than making it back. This is known as the Drawdown Trap.
Notice the curve on the left. If you lose just 10% of your capital, you only need an 11% gain to recover. That seems manageable. But look further right. If you lose 20%, you need a 25% gain to break even. When you lose 40%, the math demands a 67% gain just to get back to zero. And if you hit a 50% drawdown, you need a full 100% return to recover your original capital.
This creates a psychological trap. It's incredibly easy to lose half your money, but incredibly hard to double it back. That is why the primary goal of a professional trader is not making money; it is protecting capital to ensure survival. Profit is merely the secondary byproduct of flawless risk management. If you can't survive the losses, you can't enjoy the gains. So, always prioritize survival first.
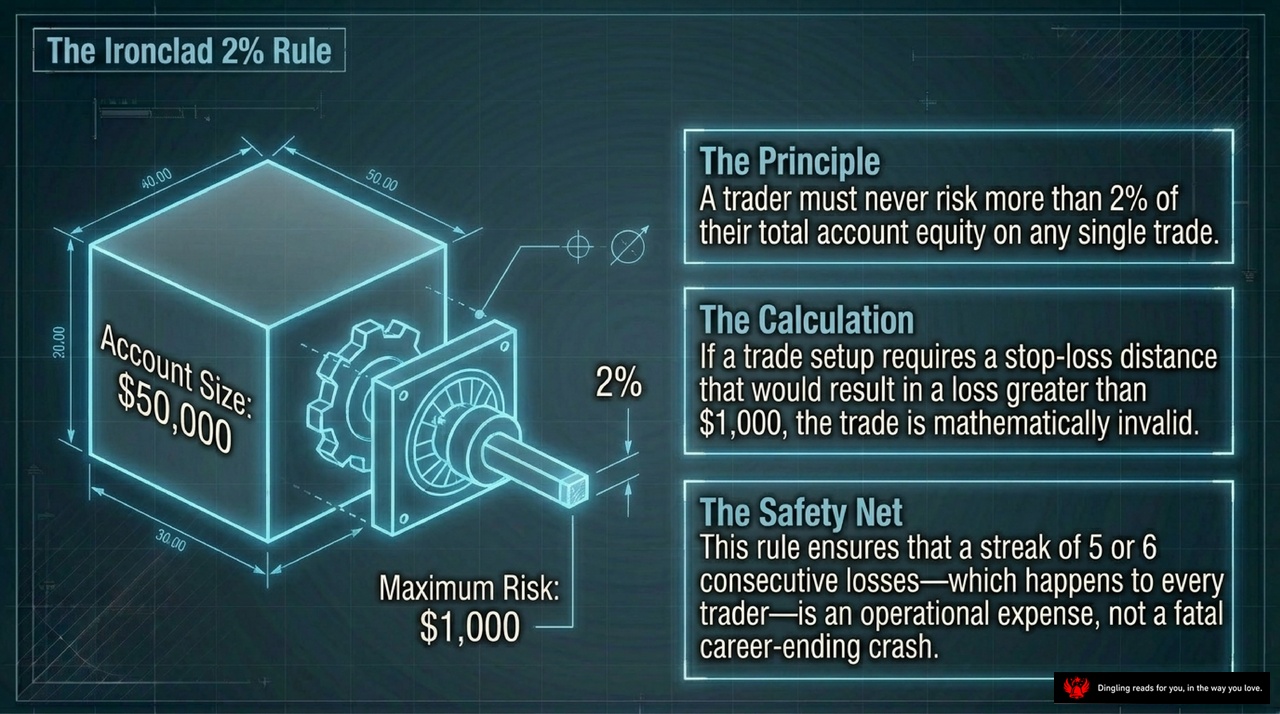
Let's talk about the "Ironclad 2% Rule," a non-negotiable safety net for every serious trader. As the slide clearly outlines, the principle is simple yet powerful: you must never risk more than 2% of your total account equity on any single trade. If your account size is $50,000, that means your maximum risk per trade is capped at exactly $1,000.
Here is the calculation behind the logic: if a trade setup requires a stop-loss distance that would result in a loss greater than that $1,000 limit, the trade is mathematically invalid. You simply walk away. No setup is good enough to justify blowing up your account.
Think of this as your ultimate safety net. This rule ensures that even if you face a streak of five or six consecutive losses—which happens to every trader at some point—those losses remain just an operational expense, not a fatal, career-ending crash. By strictly adhering to this 2% boundary, you protect your capital and keep the game going long enough to let your edge play out.
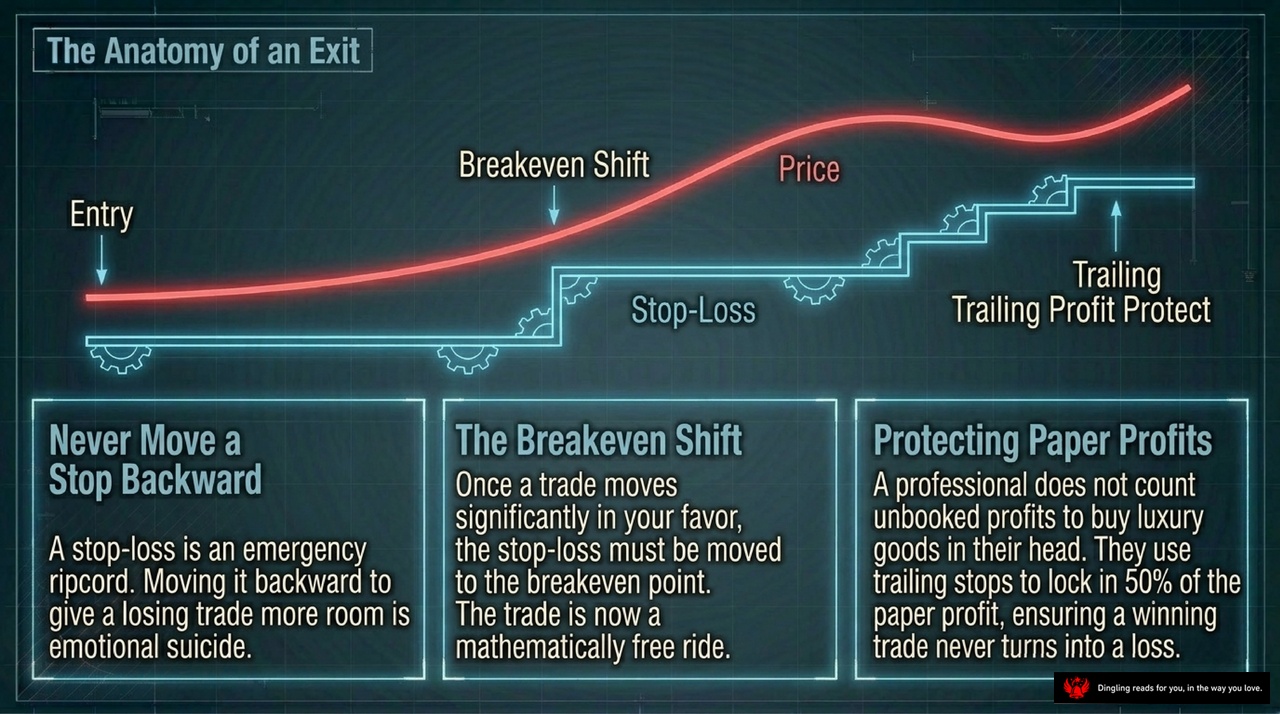
Look at this diagram, "The Anatomy of an Exit." It's a visual blueprint of how a professional trader actually locks in profits and eliminates risk. Notice that red line representing the price? It starts at your entry point, but the real magic happens in the blue staircase climbing alongside it.
First, you never move a stop-loss backward. Think of your stop-loss as an emergency ripcord. Pulling it back to give a losing trade more room is emotional suicide. Once the trade moves significantly in your favor, you must shift that stop-loss up to your breakeven point. This creates a "mathematically free ride." You've now protected your principal, meaning a winning trade can never turn into a loss.
Finally, look at that top step labeled "Trailing Profit Protect." This is where you lock in your gains. A professional doesn't count unbooked profits to buy luxury goods in their head. Instead, they use trailing stops to secure 50% of their paper profit immediately. This ensures that even if the market crashes, you walk away with a guaranteed win. It's about discipline, not hoping the market stays in your favor forever.

Imagine the trading desk not as a casino floor, but as a precision workshop where the true master trades operate. Today, we are looking at the blueprint of that master trader, a profile built on three non-negotiable pillars: Mind, Method, and Money.
Look at the structure in the center. It represents the stability required to survive. First, we have the **Mind**, defined here as "Calm Execution." Successful traders do not trade for thrills; they operate with clinical detachment. They view wins and losses as data points, not personal victories or defeats. By meticulously journaling every trade, they defeat self-sabotage before it can derail their strategy.
On the right, we see the **Method**, labeled as "Structured Logic." These traders refuse to chase gurus or buy secret systems. Instead, they rely on a rigorous framework. They use multiple timeframes—what we call the Triple Screen—to ensure they are buying value against the tide of the crowd, rather than getting swept away by short-term noise.
Finally, at the base, lies **Money**, described as "Ruthless Math." This is the most critical foundation. The master trader prioritizes survival above all else. They never risk more than 2% per trade, treating the market not as a place for gambling, but as a disciplined business of probabilities. As the quote at the bottom reminds us, "If you focus on the quality of your trading, the money will naturally follow."
When you build your trading system, do not start with the size of your position. Start with your mindset, your logical method, and your mathematical risk management. Only when these three legs are solid can you stand firm in any market condition.