
Way of the Turtle: Complete Chapter-by-Chapter Summary
Welcome to the Way of the Turtle, the declassified blueprint by Curtis M. Faith that proves legendary trading is a science of discipline, not a gift of nature.
Most people think trading is about luck or having a special instinct, but the truth is far more grounded. This book reveals that successful trading is actually a rigorous science built on discipline. It teaches you that you don't need to be a genius to profit from the markets; you just need to master the rules of risk and behavior.
The core message here is simple yet powerful: trading is not about predicting the future or guessing where prices will go. Instead, it's about managing risk with precision and sticking to a proven system. By understanding that trading is a skill you can learn and refine through practice, you can transform your approach from gambling to a strategic, long-term business.
So, whether you are new to the markets or looking to refine your strategy, remember this: consistency and discipline are your greatest assets. Embrace the process, follow the rules, and let the system work for you. That is the true way of the turtle.
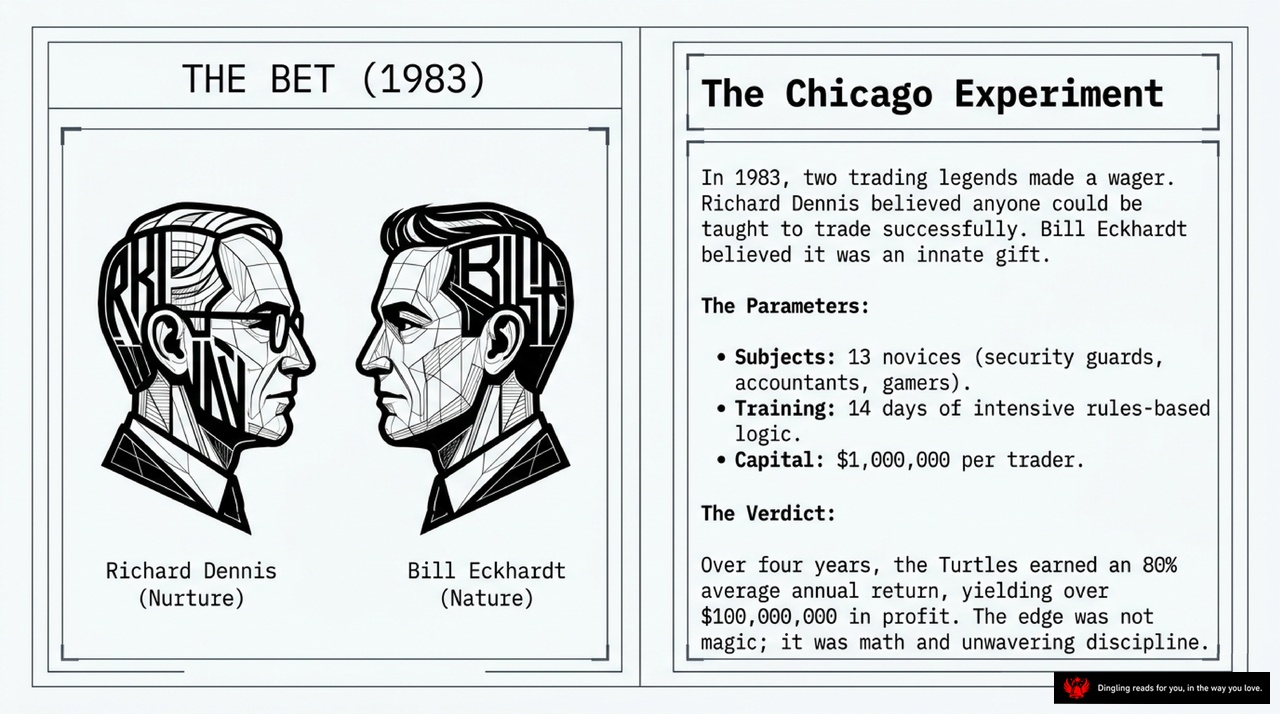
In 1983, two trading legends, Richard Dennis and Bill Eckhardt, made a wager that would change the industry forever. Dennis believed trading was a skill anyone could learn through training, while Eckhardt argued it was an innate gift. To settle the debate, they created "The Chicago Experiment," selecting 13 novices—security guards, accountants, and gamers—and subjected them to 14 days of intensive, rules-based logic training.
Each trader was given one million dollars in capital to test the hypothesis. The results were nothing short of revolutionary. Over four years, these traders, known as the Turtles, earned an average annual return of 80%, yielding over 100 million dollars in profit. The verdict was clear: the edge wasn't magic or genetics; it was math and unwavering discipline. This experiment proved that with the right system and the courage to follow it, anyone could master the markets.

The core of professional trading isn't about predicting the future; it's about deconstructing the cognitive biases that trap us all. As the slide illustrates, a mechanical system only works if the human operator can survive their own emotions. The difference between a novice and a successful trader, often called "The Turtle," lies in how they handle three critical mental traps: loss aversion, outcome bias, and predicting the future.
First, look at loss aversion. The novice holds onto losing trades, hoping the market will bounce back, simply because realizing the loss hurts. But the Turtle views losses as the standard cost of doing business and cuts them strictly at predetermined stops. You must accept that pain is the price of admission for future gains.
Next, consider outcome bias. The novice judges the quality of a decision purely by whether they made or lost money. This is dangerous because even the best strategy will have losing streaks. The Turtle, however, judges decisions based on how strictly the system rules were followed. If you followed the rules, the decision was good, regardless of the temporary result.
Finally, we have the trap of predicting the future. The novice tries to guess market direction using gut feelings or unproven theories. The Turtle accepts that the future is unknowable. Instead of guessing, they trade purely on probabilities and present market conditions. By rejecting the urge to predict and embracing a mechanical approach, you stop fighting the market and start letting the system work for you.
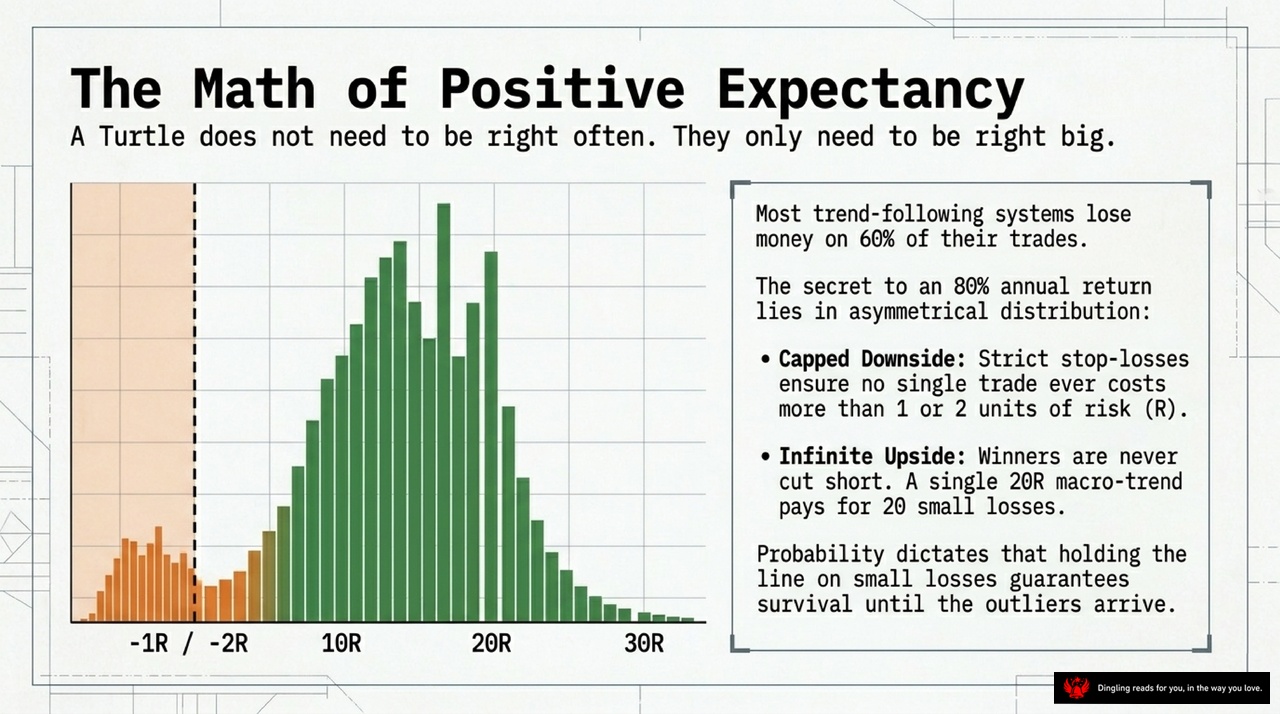
The chart on this slide perfectly illustrates a counter-intuitive truth about trading: you don't need to be right all the time. In fact, most trend-following systems lose money on about 60% of their trades. The secret to an 80% annual return isn't avoiding those losses, but rather creating an asymmetrical distribution where your winners are massive enough to cover all the small losses.
Look at the graph. The orange bars on the left represent our capped downside. Thanks to strict stop-losses, no single trade ever costs us more than 1 or 2 units of risk. We hold the line on these small losses because probability dictates that doing so guarantees our survival until the big opportunities arrive.
Then look at the green bars on the right. This represents our infinite upside. We never cut winners short. A single macro-trend can pay for 20 small losses. It's all about the math of positive expectancy. You only need to be right big, not often.
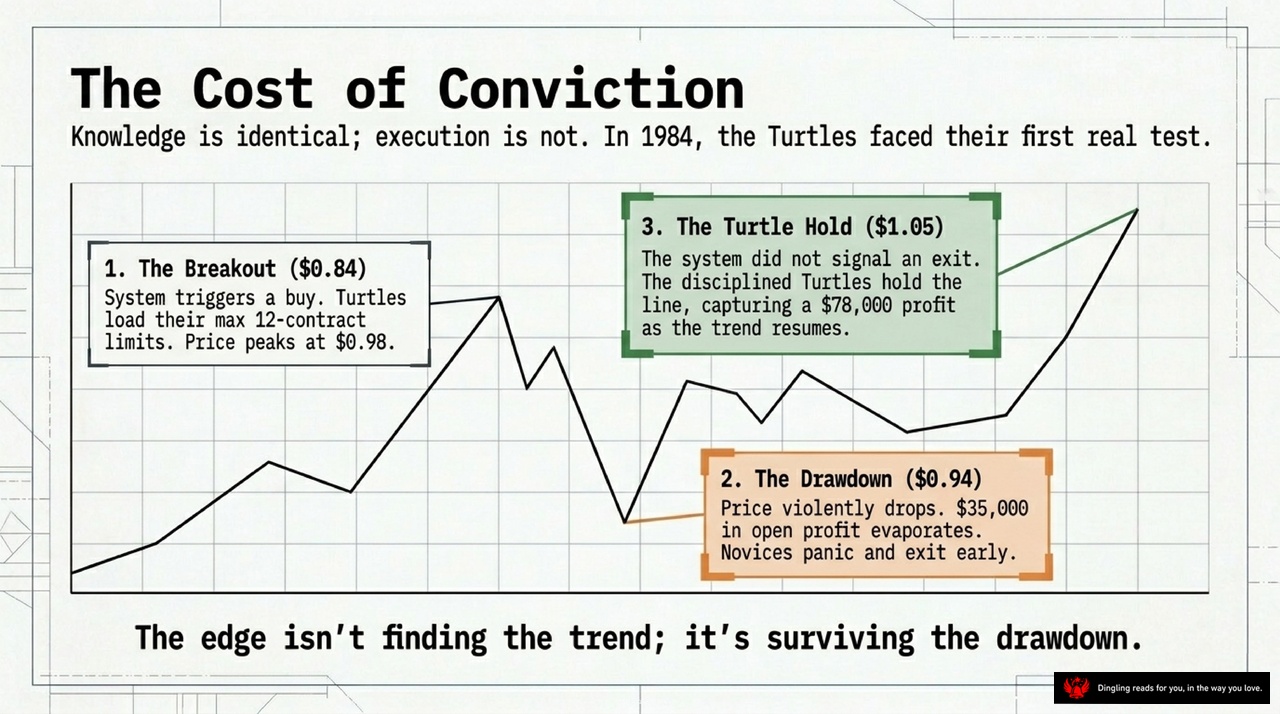
The cost of conviction isn't just a phrase; it's the harsh reality that separates the amateur from the professional. As the slide illustrates, knowledge is identical, but execution is not. In 1984, the Turtles faced their first real test, and the chart perfectly captures the two paths that diverged from a single signal.
It all started with **The Breakout** at $0.84. The system triggered a buy, and the disciplined Turtles loaded their maximum 12-contract limits. The price surged to a peak of $0.98. Here is where the story splits. Novices, terrified by the volatility, panicked and exited early. They couldn't stomach the pain of seeing their profits vanish. This led to **The Drawdown** at $0.94. The price violently dropped, and for those who stayed, $35,000 in open profit evaporated. It was a brutal reminder that survival requires patience.
But the disciplined Turtles did the opposite. They held the line. They trusted the system even when the chart was screaming at them to run. They endured the drawdown because they knew the trend was still alive. Then came **The Turtle Hold** at $1.05. The system never signaled an exit, so they stayed in. As the trend resumed and climbed, they captured a staggering $78,000 profit. That final trade was worth three times more than what the panicked traders would have ever earned.
The lesson is crystal clear: the edge isn't about finding the trend; it's about surviving the drawdown. Without the courage to hold through the pain, you lose the reward.

In the world of trend following, there is no magic crystal ball that can perfectly predict the future. Instead, we treat our trading toolkit as a set of building blocks—simple, functional pieces designed to help us tilt the odds slightly in our favor over time. The core of trend following isn't about guessing where the market is going; it's about identifying exactly where the market is right now.
Think of the market as having four distinct states: stable and quiet, stable and volatile, trending and quiet, or trending and volatile. Each state demands a different approach. That's why trend followers rely on these "blocks" to diagnose the current environment. Tools like moving averages smooth out the noise to reveal the long-term direction, while channel breakouts, like the famous Donchian Channel, signal when price has finally pushed through key barriers.
But we don't just use these tools blindly; we combine them to filter out the noise. We use volatility indicators to adjust our stops, and trend strength meters to decide when to hold tight or when to get out. Sometimes, a simple combination—using a moving average for direction and a breakout for entry—works better than a complex web of indicators. The key isn't knowing every tool in the shop, but understanding how to use the right one at the right moment.
The Turtle system offers six classic long-term trend-following systems, each built on these principles. From the ATR Channel Breakout System, which dynamically adjusts channel width based on market volatility, to the Bollinger Breakout System, which uses standard deviation to gauge market heat, these systems all share a common goal: capturing momentum. Whether it's the classic Donchian Trend System with its 20-day breakout and trend filter, or the Dual Moving Average System that stays fully invested by crossing short and long-term averages, the logic remains the same. We aren't predicting the peak or the bottom; we are simply waiting for the market to tell us it has changed, and then we join the move.

In the world of trend following, there is no crystal ball that can predict the future with certainty. Every tool we have—moving averages, channel breaks, volatility indicators—is just a piece of a puzzle, helping us tilt the odds slightly in our favor over time. The core of this strategy isn't about guessing; it's about identifying the current state of the market. Is it calm and flat? Is it choppy but trending? Or is it volatile? Each state demands a different approach.
To navigate this, we use specific "building blocks." Moving averages smooth out the noise to show the long-term direction. Channel breaks, like the famous Donchian Channel, signal when a trend might be starting or ending. Other tools help us filter out false signals or adjust our stop-losses based on how wild the market is right now. The key isn't to know every tool, but to understand when to use which one.
The Turtle methodology offers six classic long-term trend systems, each with its own logic. The ATR Channel Break uses volatility to dynamically adjust the channel width. The Bollinger Break system does something similar but uses standard deviation. The classic Donchian system relies on 20-day and 10-day breaks, often with a trend filter to avoid counter-trend traps. There are also systems based purely on moving average crossovers, like the Double and Triple Moving Average systems, which stay in the market constantly, buying and selling based on the alignment of different timeframes.
But knowing the system isn't enough; we must test it. Historical backtesting is our best friend, but it has traps. We must be careful of "overfitting"—making a system so complex that it works perfectly on past data but fails in the future. We also need to look beyond simple metrics like annual growth rates, which can be misleading depending on the start and end dates. Instead, we use robust metrics like Regression Annualized Return and Monte Carlo simulations to stress-test our strategies, ensuring they survive not just one perfect run, but hundreds of slightly different realities. This rigorous approach separates true edge from lucky guesses.

The Math of Survival: Quantifying 'N'
Here's the core truth the Turtles learned early on: markets don't all move the same way. A quiet, stable market behaves completely differently from a volatile, choppy one. If you size your positions based on the same dollar amount regardless of the market, you're playing with fire in the high-volatility zones.
To fix this, the Turtles developed a simple but powerful algorithm to standardize risk. They use a metric called 'N', which stands for the Average True Range. Think of 'N' as a thermometer for the market's daily volatility. It measures the absolute price movement, accounting for gaps, so you know exactly how much the market swings on any given day.
The logic is elegant and straightforward. You feed the current market volatility into 'The N Algorithm,' specifically a 20-day Exponential Moving Average of the True Range. This gives you a dynamic baseline for what "normal" movement looks like right now.
Once you have that number, you apply a strict rule: every single trade must risk exactly 1% of your total account equity. This is the golden rule of survival.
If you're in a high-volatility market, where prices are swinging wildly, your 'N' value is large. To keep that 1% risk constant, you must reduce your position size. You buy fewer contracts. Conversely, if you're in a low-volatility market where prices are moving slowly, your 'N' is small. This allows you to increase your position size safely, because the market isn't going to move against you as violently.
The result is a level playing field. Whether the market is screaming with volatility or whispering with calm, a single day's fluctuation against your stop-loss impacts your portfolio by the exact same dollar amount. This ensures that you never over-expose yourself during the dangerous times, and you have enough firepower to capitalize when the market is quiet and stable. It's not about predicting the future; it's about mathematically ensuring that your risk is always under control, no matter what the market throws at you.

Welcome back. Today we're diving into the engine that powers the Turtle Trading System: The Position Sizing Algorithm. This is exactly how the Turtles translated market volatility into exact contract sizes. It's not about guessing where the market is going; it's about calculating exactly how much you can afford to lose on the way there.
The process starts with Step 1: Account Equity. You simply determine 1% of your total trading capital. For example, if you have a $1 million account, your risk per trade is $10,000. This sets your baseline.
Next, Step 2: Calculate N. You need to find the 20-day exponential moving average of the True Range. Think of N as the market's heartbeat—it tells you how much that specific market typically moves in a day. A volatile market has a high N; a calm one has a low N.
In Step 3, we calculate Dollar Volatility. You multiply that N value by the dollar value of one point in your target contract. This gives you the actual dollar amount the market swings every day.
Finally, Step 4: The Unit Size. This is the magic step. You divide your Account Equity from Step 1 by the Dollar Volatility from Step 3. This formula dictates the exact number of contracts to buy per unit. The logic is brilliant: if a market is highly volatile, N is high, so your unit size shrinks. If a market is quiet, N is low, so you can hold more contracts. This ensures that no matter which market you trade, your risk remains consistent.
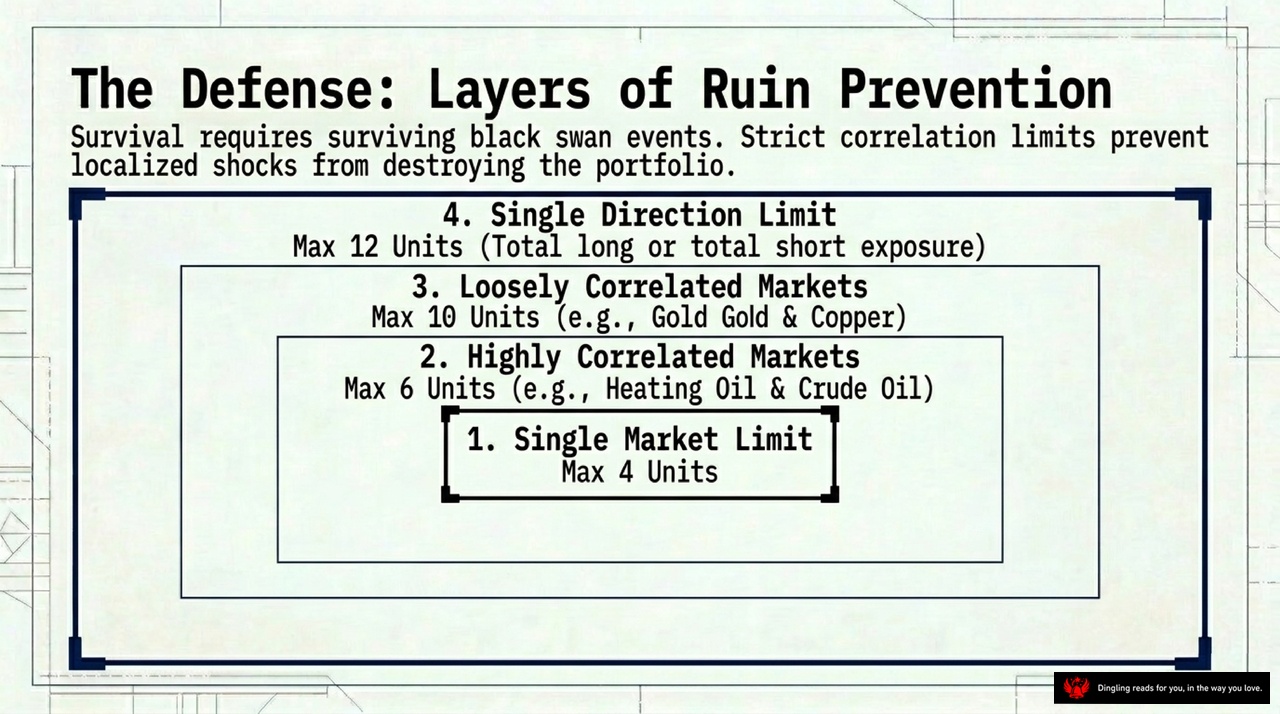
In the high-stakes world of trading, success isn't about finding a magical "holy grail" system or predicting the future with crystal-ball precision. It's about mastering the one variable that no algorithm can hack: your own psychology. As we wrap up our deep dive into the Turtle Trading methodology, the most profound lesson isn't found in the entry signals or the ATR-based position sizing—it's in the unwavering discipline to execute a simple system, even when it feels wrong.
Richard Dennis famously said, "You can put my trading rules in the newspaper, but nobody will follow them." Why? Because the real battle isn't against the market; it's against your own ego and fear. The most successful Turtles weren't the smartest or the fastest; they were the ones who could sit through months of small losses, watching their profits evaporate, without touching their buttons. They understood that consistency beats intensity. While others were chasing every signal, tweaking their systems based on gut feelings, or quitting after a string of losses, the winners stuck to the plan. They trusted the math over their emotions.
This mechanical approach is what separates the amateurs from the professionals. Amateurs try to outsmart the market with complex indicators and subjective judgments, often falling victim to the very human biases we discussed earlier—like loss aversion or the recency bias. But the Turtle system removes the human element from the decision-making process. It provides a clear rulebook for every scenario: when to enter, how much to risk, where to stop out, and exactly when to exit. When you remove the guesswork, you stop fighting yourself. You become a machine that simply executes a strategy with a positive expectancy.
Ultimately, the Turtle legacy teaches us that trading is a marathon, not a sprint. It requires the courage to be boring, the humility to accept that you can't control the outcome of any single trade, and the discipline to trust the process over the pain. In a world full of noise and hype, the most powerful tool you have is a simple, well-defined system and the iron will to follow it, no matter how turbulent the waters get. That is the true edge that allows you to survive black swan events and thrive in the long run.
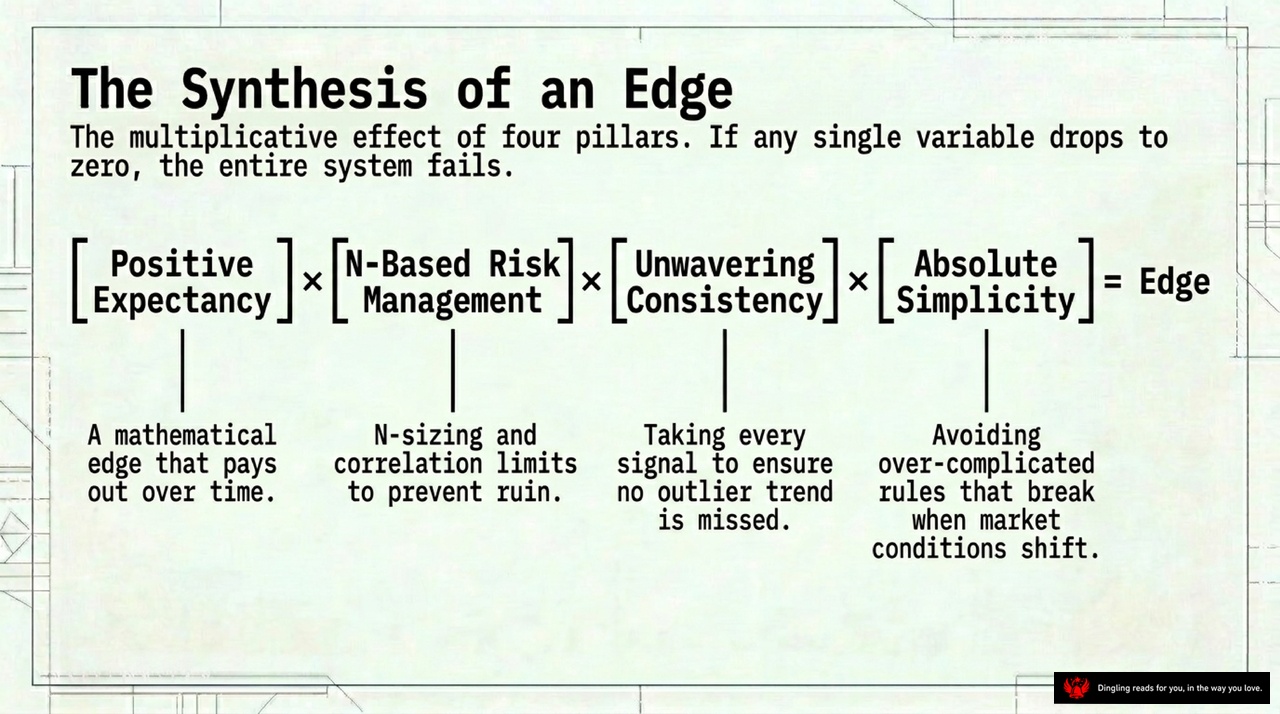
The synthesis of an edge isn't about finding a single magic bullet; it's about building a fortress where four pillars multiply each other to create an unstoppable force. As this slide clearly outlines, if any single variable drops to zero, the entire system collapses. Think of it like a chain: the strength of the whole is determined by its weakest link.
First, we need **Positive Expectancy**. This is the mathematical foundation—the statistical advantage that ensures you make money over time, even if you lose on individual trades. Without this, you're just gambling. But a good system means nothing without **N-Based Risk Management**. This is your safety net. By using volatility to size your positions, you ensure that no single loss can wipe you out, preventing ruin during inevitable drawdowns.
However, knowing the rules isn't enough; you must have **Unwavering Consistency**. This means executing every signal, even the small losers, and never missing a trend because you got scared. Finally, you need **Absolute Simplicity**. Over-complicating your rules with exceptions is the fastest way to fail when market conditions shift. You need rules that are robust and simple enough to follow blindly.
When you combine these four elements—expectancy, risk control, consistency, and simplicity—you don't just have a strategy; you have a sustainable edge. It's the difference between being a victim of the market and becoming its master.

The Mechanical Entry: System 1 & System 2.
Turtles didn't just rely on one trick; they operated two parallel, purely mechanical breakout systems to ensure no macro-trend was ever missed. Think of it as having a short-term radar and a long-term compass running simultaneously.
On the left, we have System 1, the Medium-Term engine. This system triggers an entry when the price breaks out of the 20-day high or sells at the 20-day low. Once in the trade for longs, the exit rule is simple: get out at the 10-day low. But here is the critical rule that keeps the noise out: if the previous System 1 signal was a winning trade, you ignore the current one. You don't pile on after a winner; you wait for a fresh opportunity.
On the right sits System 2, the Long-Term powerhouse. This is the trend's true backbone. It buys at the 60-day high breakout. The exit is a 20-day low for longs. The rule here is absolute discipline: take every System 2 signal, regardless of previous outcomes. It acts as a fail-safe. While System 1 might hesitate after a win, System 2 never flinches. It captures the massive, multi-month moves that define wealth.
By running these two systems in parallel, the Turtle strategy balances speed with endurance, ensuring you catch the trend whether it's just starting or well underway.
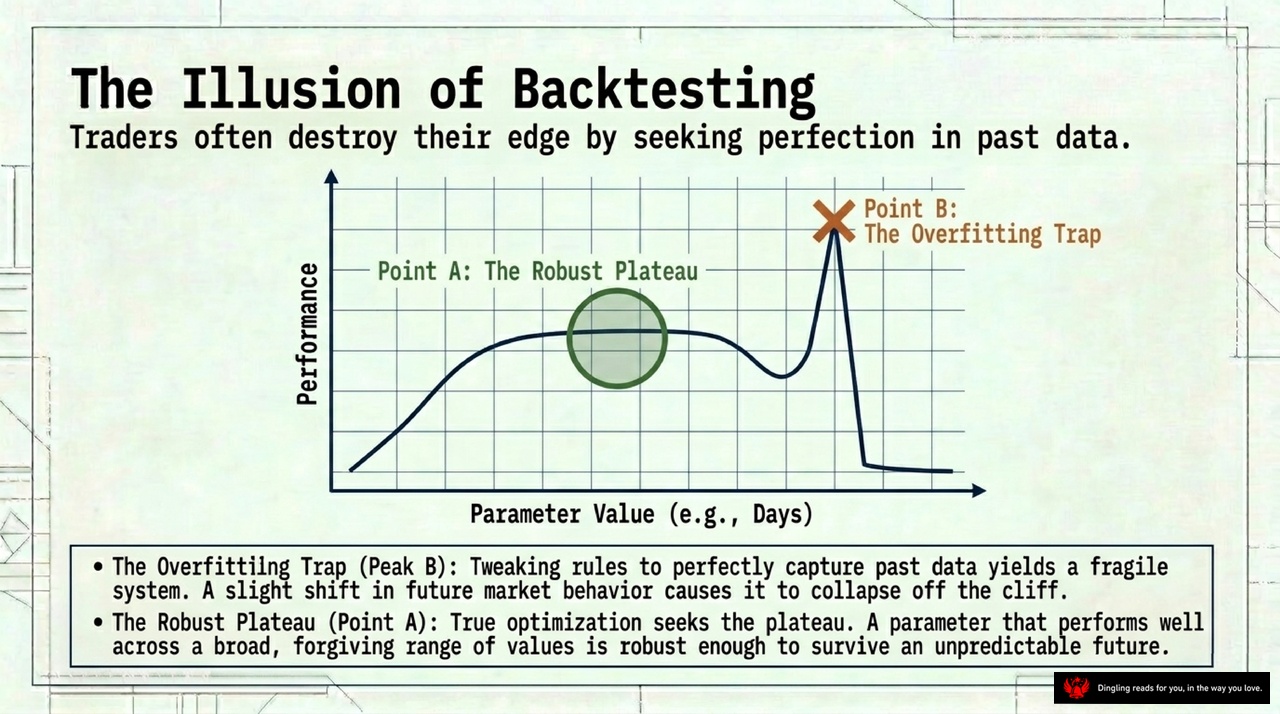
The Illusion of Backtesting is a critical lesson for any trader who thinks they can engineer perfection. Look at this graph. On the far right, you see Point B, labeled "The Overfitting Trap." This is what happens when traders tweak their rules obsessively to perfectly capture past data. They chase a single peak, believing it's the holy grail. But the result? A fragile system that looks amazing on paper but collapses the moment the market shifts slightly. It's like building a house on a cliff edge; one small wind change, and it falls off.
In contrast, look at Point A, "The Robust Plateau." True optimization isn't about finding that one perfect spike. It's about seeking the plateau—a parameter that performs well across a broad, forgiving range of values. This is what makes a strategy robust enough to survive an unpredictable future. If your strategy works well even when you nudge the parameters slightly, you have a real edge. If it only works on one exact setting, you've just overfitted the history. Don't destroy your edge by seeking perfection in the past; instead, aim for consistency that can handle the chaos of tomorrow.

Surviving the Crowd: The Trader Effect. When a strategy becomes too popular, the crowd's anticipated behavior destroys the edge. Look at this spectrum: on the left, we have Simple & Robust systems; on the right, Complex & Curve-Fit ones.
The Power of Simplicity lies on the green side. Basic Donchian breakouts are biologically robust. Like simple organisms, simple trading rules survive regime changes because they do not rely on rigid, perfectly repeating conditions. They are designed to be flexible enough to adapt when the market shifts.
Conversely, the Danger of Complexity lives on the orange side. Systems with dozens of bespoke rules—like selling only on Tuesdays in September—are hyper-vulnerable to randomness. They reflect noise, not signal. When these complex strategies become popular, everyone starts trading based on the same specific conditions. The market anticipates this behavior and moves against it, causing the edge to vanish.
In a crowded room, the most obvious paths are often the traps. To survive, you must embrace the simplicity that allows you to withstand the chaos, rather than building fragile complexity that breaks under the weight of the crowd.
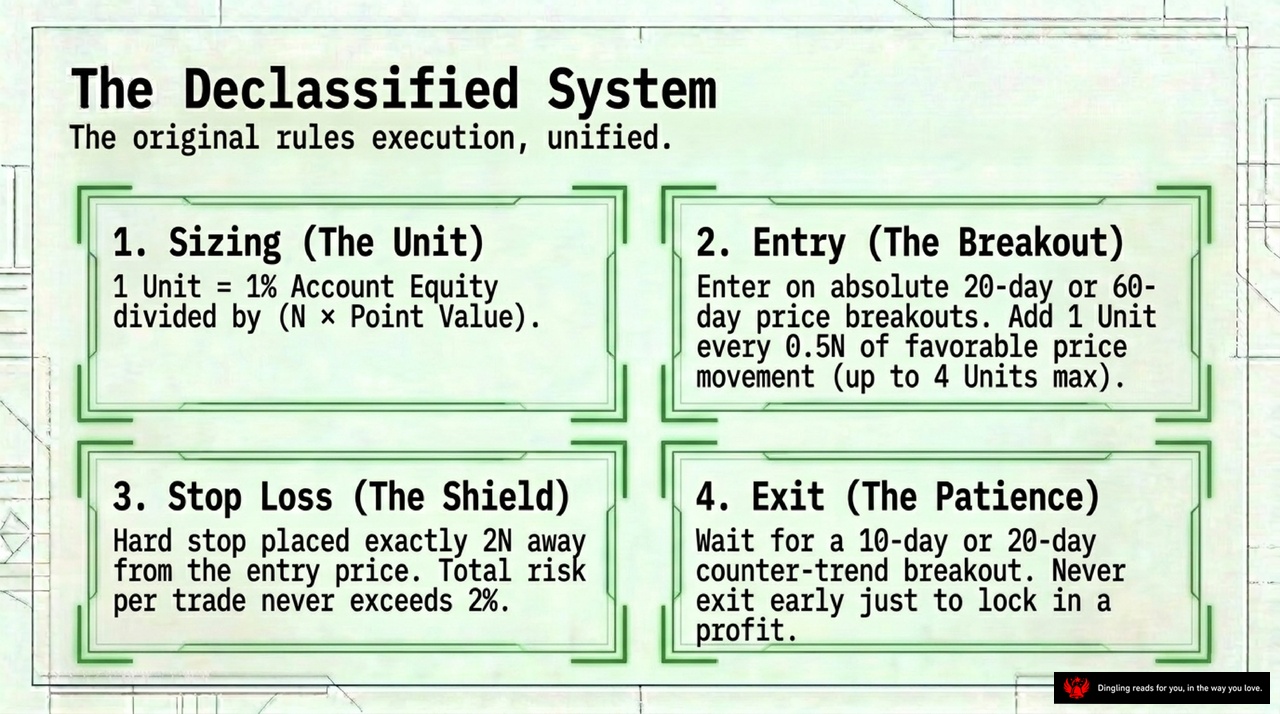
Welcome back to the declassified system. Today, we're looking at the unified execution rules that turned a simple set of principles into a legendary trading strategy.
First, let's talk about sizing, or "The Unit." The core idea here is standardization. One unit is defined as 1% of your account equity divided by the point value of the market. But why do it this way? Because markets have different levels of volatility. By using the N value—essentially the average daily range—you ensure that a one-unit move in a highly volatile market like oil carries the same dollar risk as a one-unit move in a calmer market like bonds. This allows you to hold fewer contracts in volatile markets and more in stable ones, keeping your risk consistent across the board.
Next is entry, or "The Breakout." You don't guess; you wait for absolute price breakouts, specifically off the 20-day or 60-day highs and lows. Once the signal fires, you enter with one unit. But here's the key to scaling: you add one more unit every time the price moves favorably by half an N. This pyramiding method lets you stay light at the start and build a strong position as the trend confirms itself, all while keeping your stop loss at exactly two Ns away to protect your capital.
Finally, we have the exit, which is all about "The Patience." This is where most traders fail. The rule is strict: never exit early just to lock in a profit. Instead, you wait for a counter-trend breakout, either after 10 or 20 days, to signal that the trend is truly over. This discipline is what separates the amateurs who chase every small move from the professionals who ride the big trends to their full conclusion. By sticking to these four pillars—sizing, entry, stop loss, and exit—you transform trading from a gamble into a calculated, repeatable process.

"End of File." That's the headline, but don't let it fool you. This isn't a stop sign; it's the most important page in the entire playbook.
The Turtle experiment proved something revolutionary: legendary trading isn't about some innate, magical talent you're born with. It's an engineered process. Think of it like building a machine where every gear fits perfectly. You combine a mathematical edge—what we call expectancy—with an equalizer for volatility, known as N-sizing. You layer in strict defense against ruin and the psychological discipline to execute relentlessly.
When you stack these elements, something magical happens. The chaotic noise of the market gets transformed into predictable, long-term wealth. The text asks a haunting question: If the rules for generating millions are simple, known, and mathematically proven, why are so few people capable of following them?
The answer lies in the gap between knowing and doing. Most traders fail not because they lack the blueprint, but because they refuse to build the house. They crave the thrill of prediction and the ego of being "right" on every trade, rather than the humble, mechanical consistency required to win. True success isn't about finding a secret tip; it's about having the courage to follow a boring, proven system when it's screaming at you to break the rules. That's the real lesson here.